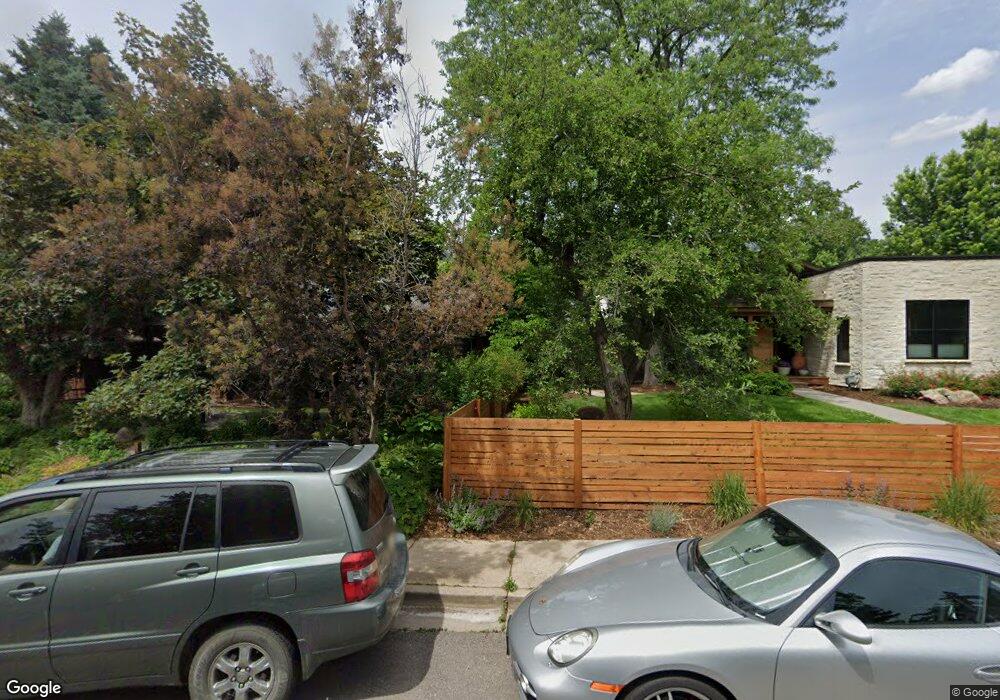
3227 9th St Boulder, CO 80304
Newlands NeighborhoodEstimated Value: $1,394,543 - $1,769,000
2
Beds
2
Baths
1,711
Sq Ft
$921/Sq Ft
Est. Value
About This Home
This home is located at 3227 9th St, Boulder, CO 80304 and is currently estimated at $1,576,136, approximately $921 per square foot. 3227 9th St is a home located in Boulder County with nearby schools including Foothill Elementary School, Casey Middle School, and Boulder High School.
Ownership History
Date
Name
Owned For
Owner Type
Purchase Details
Closed on
Jan 23, 2002
Sold by
Schwartz Michael and Cranbourne Nancy
Bought by
Schwartz Michael F
Current Estimated Value
Purchase Details
Closed on
Aug 1, 1991
Bought by
Schwartz Michael F and Cranbourne Nancy B
Purchase Details
Closed on
Jun 17, 1988
Bought by
Schwartz Michael F and Cranbourne Nancy B
Purchase Details
Closed on
Sep 16, 1981
Bought by
Schwartz Michael F and Cranbourne Nancy B
Purchase Details
Closed on
May 23, 1974
Bought by
Schwartz Michael F and Cranbourne Nancy B
Create a Home Valuation Report for This Property
The Home Valuation Report is an in-depth analysis detailing your home's value as well as a comparison with similar homes in the area
Home Values in the Area
Average Home Value in this Area
Purchase History
| Date | Buyer | Sale Price | Title Company |
|---|---|---|---|
| Schwartz Michael F | -- | -- | |
| Schwartz Michael F | $145,000 | -- | |
| Schwartz Michael F | $105,000 | -- | |
| Schwartz Michael F | $86,000 | -- | |
| Schwartz Michael F | $36,700 | -- |
Source: Public Records
Tax History
| Year | Tax Paid | Tax Assessment Tax Assessment Total Assessment is a certain percentage of the fair market value that is determined by local assessors to be the total taxable value of land and additions on the property. | Land | Improvement |
|---|---|---|---|---|
| 2025 | $9,562 | $111,569 | $96,125 | $15,444 |
| 2024 | $9,562 | $111,569 | $96,125 | $15,444 |
| 2023 | $9,397 | $115,508 | $106,530 | $12,663 |
| 2022 | $8,471 | $91,219 | $76,506 | $14,713 |
| 2021 | $8,078 | $93,844 | $78,707 | $15,137 |
| 2020 | $7,351 | $84,456 | $67,568 | $16,888 |
| 2019 | $7,239 | $84,456 | $67,568 | $16,888 |
| 2018 | $6,340 | $73,123 | $55,944 | $17,179 |
| 2017 | $6,141 | $80,842 | $61,849 | $18,993 |
| 2016 | $6,217 | $71,815 | $46,486 | $25,329 |
| 2015 | $5,887 | $39,712 | $17,273 | $22,439 |
| 2014 | $3,339 | $39,712 | $17,273 | $22,439 |
Source: Public Records
Map
Nearby Homes
- 1023 Forest Ave
- 865 Grape Ave Unit X
- 3135 11th St
- 3056 8th St
- 3086 11th St
- 711 Hawthorn Ave
- 501 Evergreen Ave
- 3189 5th St
- 640 Iris Ave
- 3315 Broadway St
- 2958 6th St
- 1237 Elder Ave Unit 1
- 521 Hawthorn Ave
- 503 Hawthorn Ave
- 656 Juniper Ave
- 3319 Broadway
- 1070 Juniper Ave
- 706 Juniper Ave
- 300 Forest Ave
- 440 Japonica Way
Your Personal Tour Guide
Ask me questions while you tour the home.