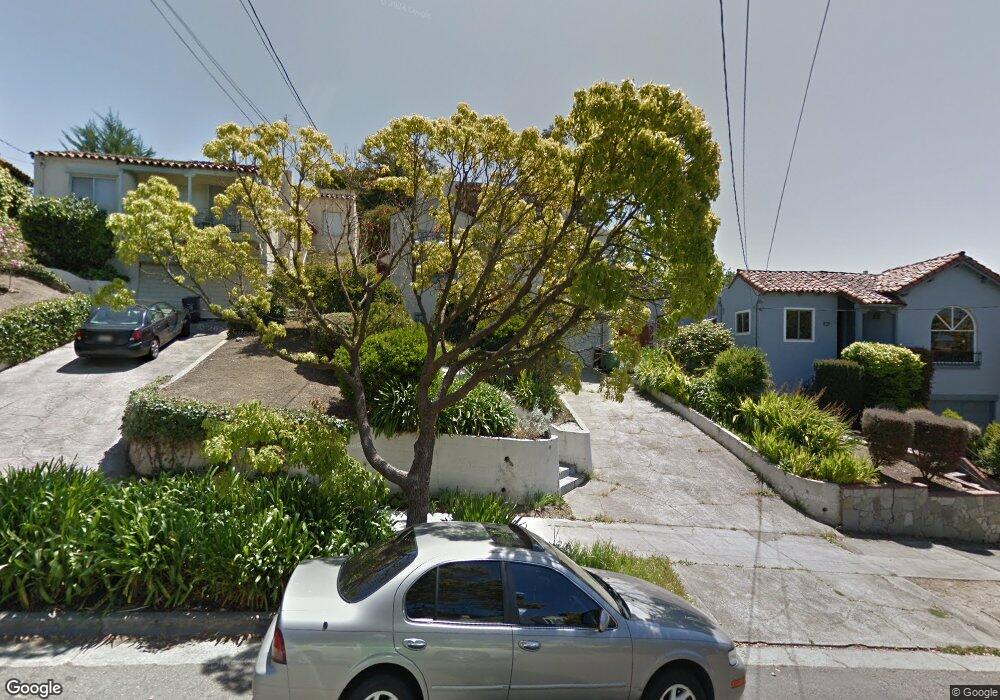
3234 Morcom Ave Oakland, CA 94619
Maxwell Park NeighborhoodEstimated Value: $924,000 - $1,068,000
4
Beds
3
Baths
2,597
Sq Ft
$377/Sq Ft
Est. Value
About This Home
This home is located at 3234 Morcom Ave, Oakland, CA 94619 and is currently estimated at $979,146, approximately $377 per square foot. 3234 Morcom Ave is a home located in Alameda County with nearby schools including Laurel Elementary School, Frick United Academy of Language, and Skyline High School.
Ownership History
Date
Name
Owned For
Owner Type
Purchase Details
Closed on
Apr 19, 2019
Sold by
Oluwasogo Ade O and Oluwasogo Ade
Bought by
Oluwasogo Ade O and Ade O Oluwasogo Living Trust
Current Estimated Value
Purchase Details
Closed on
May 15, 2001
Sold by
Price Antoinette
Bought by
Oluwasogo Ade
Home Financials for this Owner
Home Financials are based on the most recent Mortgage that was taken out on this home.
Original Mortgage
$275,000
Outstanding Balance
$102,913
Interest Rate
7.06%
Estimated Equity
$876,233
Create a Home Valuation Report for This Property
The Home Valuation Report is an in-depth analysis detailing your home's value as well as a comparison with similar homes in the area
Home Values in the Area
Average Home Value in this Area
Purchase History
| Date | Buyer | Sale Price | Title Company |
|---|---|---|---|
| Oluwasogo Ade O | -- | None Available | |
| Oluwasogo Ade | $435,000 | Placer Title Company |
Source: Public Records
Mortgage History
| Date | Status | Borrower | Loan Amount |
|---|---|---|---|
| Open | Oluwasogo Ade | $275,000 |
Source: Public Records
Tax History
| Year | Tax Paid | Tax Assessment Tax Assessment Total Assessment is a certain percentage of the fair market value that is determined by local assessors to be the total taxable value of land and additions on the property. | Land | Improvement |
|---|---|---|---|---|
| 2025 | $10,030 | $655,427 | $196,628 | $458,799 |
| 2024 | $10,030 | $642,577 | $192,773 | $449,804 |
| 2023 | $10,519 | $629,980 | $188,994 | $440,986 |
| 2022 | $10,243 | $617,630 | $185,289 | $432,341 |
| 2021 | $9,804 | $605,520 | $181,656 | $423,864 |
| 2020 | $9,696 | $599,311 | $179,793 | $419,518 |
| 2019 | $9,338 | $587,562 | $176,268 | $411,294 |
| 2018 | $9,143 | $576,044 | $172,813 | $403,231 |
| 2017 | $8,796 | $564,751 | $169,425 | $395,326 |
| 2016 | $8,512 | $553,680 | $166,104 | $387,576 |
| 2015 | $8,467 | $545,367 | $163,610 | $381,757 |
| 2014 | $8,532 | $534,688 | $160,406 | $374,282 |
Source: Public Records
Map
Nearby Homes
- 5091 Macarthur Blvd
- 5407 Roberts Ave
- 3000 56th Ave
- 4737 Redding St
- 3044 58th Ave
- 5721 Roberts Ave
- 3266 Knowland Ave
- 3121 Monticello Ave
- 25 Redding Place
- 5230 Hillen Dr
- 2927 Seminary Ave
- 5922 Camden St
- 4535 Redding St
- 2832 Monticello Ave
- 2745 Maxwell Ave
- 3118 60th Ave
- 3040 60th Ave
- 3042 60th Ave
- 2600 55th Ave
- 6021 Monadnock Way
- 3238 Morcom Ave
- 3230 Morcom Ave
- 3226 Morcom Ave
- 3242 Morcom Ave
- 3222 Morcom Ave
- 3243 Wyman St
- 3237 Wyman St
- 3249 Wyman St
- 3231 Wyman St
- 3248 Morcom Ave
- 3216 Morcom Ave
- 3255 Wyman St
- 3408 Simmons St
- 3225 Wyman St
- 3261 Wyman St
- 3233 Morcom Ave
- 3416 Simmons St
- 3239 Morcom Ave
- 3225 Morcom Ave
- 3219 Wyman St
Your Personal Tour Guide
Ask me questions while you tour the home.