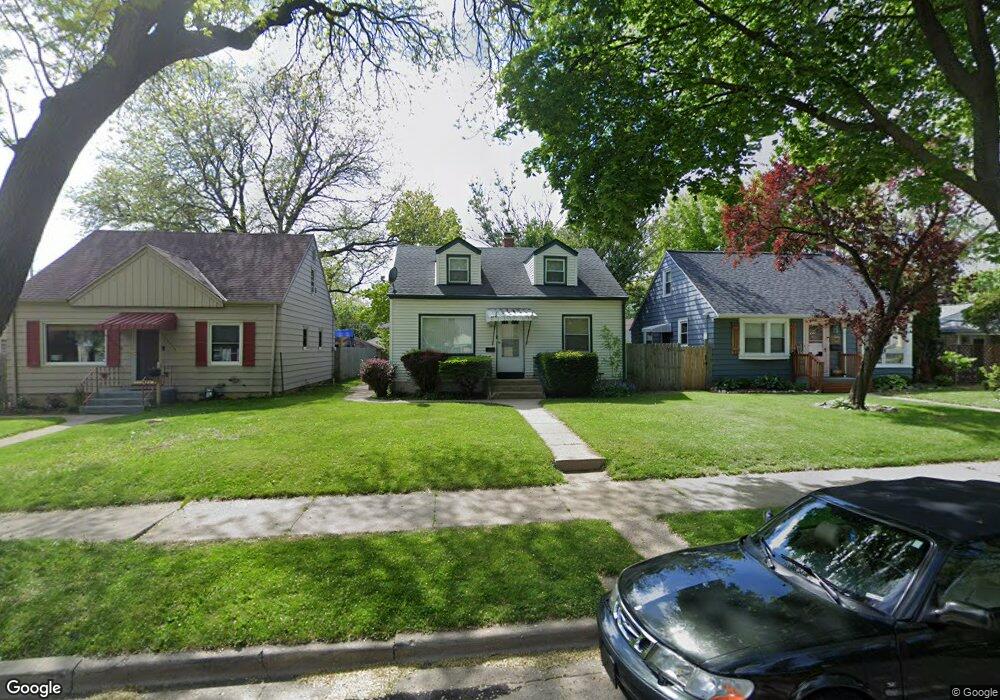
3239 N 78th St Milwaukee, WI 53222
Kops Park NeighborhoodEstimated Value: $233,778 - $245,000
3
Beds
1
Bath
1,176
Sq Ft
$203/Sq Ft
Est. Value
About This Home
This home is located at 3239 N 78th St, Milwaukee, WI 53222 and is currently estimated at $239,195, approximately $203 per square foot. 3239 N 78th St is a home located in Milwaukee County with nearby schools including Eighty-First Street School, Milwaukee German Immersion School, and Craig Montessori School.
Ownership History
Date
Name
Owned For
Owner Type
Purchase Details
Closed on
May 12, 2006
Sold by
Birmingham Mary Jo and Preston Mary Jo
Bought by
Holleback Katie A
Current Estimated Value
Home Financials for this Owner
Home Financials are based on the most recent Mortgage that was taken out on this home.
Original Mortgage
$119,900
Outstanding Balance
$70,468
Interest Rate
6.66%
Mortgage Type
Purchase Money Mortgage
Estimated Equity
$168,727
Purchase Details
Closed on
May 10, 2002
Sold by
Herbst Daniel V and Herbst Jennifer L
Bought by
Birmingham Mary Jo
Home Financials for this Owner
Home Financials are based on the most recent Mortgage that was taken out on this home.
Original Mortgage
$99,750
Interest Rate
7%
Mortgage Type
Purchase Money Mortgage
Purchase Details
Closed on
Dec 29, 1998
Sold by
Beese Susan L
Bought by
Herbst Daniel
Home Financials for this Owner
Home Financials are based on the most recent Mortgage that was taken out on this home.
Original Mortgage
$87,500
Interest Rate
6.79%
Mortgage Type
Purchase Money Mortgage
Create a Home Valuation Report for This Property
The Home Valuation Report is an in-depth analysis detailing your home's value as well as a comparison with similar homes in the area
Home Values in the Area
Average Home Value in this Area
Purchase History
| Date | Buyer | Sale Price | Title Company |
|---|---|---|---|
| Holleback Katie A | $149,900 | None Available | |
| Birmingham Mary Jo | $105,000 | -- | |
| Herbst Daniel | $70,000 | -- |
Source: Public Records
Mortgage History
| Date | Status | Borrower | Loan Amount |
|---|---|---|---|
| Open | Holleback Katie A | $119,900 | |
| Previous Owner | Birmingham Mary Jo | $99,750 | |
| Previous Owner | Herbst Daniel | $87,500 |
Source: Public Records
Tax History
| Year | Tax Paid | Tax Assessment Tax Assessment Total Assessment is a certain percentage of the fair market value that is determined by local assessors to be the total taxable value of land and additions on the property. | Land | Improvement |
|---|---|---|---|---|
| 2024 | $3,936 | $175,500 | $17,300 | $158,200 |
| 2023 | $3,599 | $152,300 | $17,300 | $135,000 |
| 2022 | $3,553 | $152,300 | $17,300 | $135,000 |
| 2021 | $3,533 | $137,100 | $17,200 | $119,900 |
| 2020 | $3,513 | $137,100 | $17,200 | $119,900 |
| 2019 | $3,055 | $124,300 | $18,600 | $105,700 |
| 2018 | $3,149 | $124,300 | $18,600 | $105,700 |
| 2017 | $3,159 | $118,400 | $19,400 | $99,000 |
| 2016 | $3,162 | $112,800 | $19,400 | $93,400 |
| 2015 | $3,166 | $110,600 | $19,400 | $91,200 |
| 2014 | $3,235 | $110,600 | $19,400 | $91,200 |
| 2013 | -- | $105,400 | $19,400 | $86,000 |
Source: Public Records
Map
Nearby Homes
- 3128 N 82nd St
- 8105 W Townsend St
- 3132 N 83rd St
- 3015 N 75th St
- 2924 N 79th St Unit 2926
- 3520 N 77th St
- 3526 N 77th St
- 3437 N 83rd St Unit 3439
- 3047 N 72nd St
- 8415 W Burleigh St
- 3623 N 76th St
- 8435 W Townsend St
- 8408 W Lisbon Ave
- 3238 N 86th St
- 2908 N 74th St
- 8441 W Lisbon Ave
- 2830 N 78th St
- 2846 N 81st St
- 3261 N 86th St
- 8525 W Lisbon Ave
- 3245 N 78th St
- 3251 N 78th St
- 3223 N 78th St
- 3255 N 78th St
- 3226 N 79th St
- 3222 N 79th St
- 3232 N 79th St
- 3219 N 78th St
- 3216 N 79th St
- 3236 N 79th St
- 3240 N 78th St
- 3248 N 78th St
- 3232 N 78th St
- 3210 N 79th St
- 3242 N 79th St
- 3228 N 78th St
- 3211 N 78th St
- 3242 N 79th St Street North St N
- 3206 N 79th St
- 3224 N 78th St
Your Personal Tour Guide
Ask me questions while you tour the home.