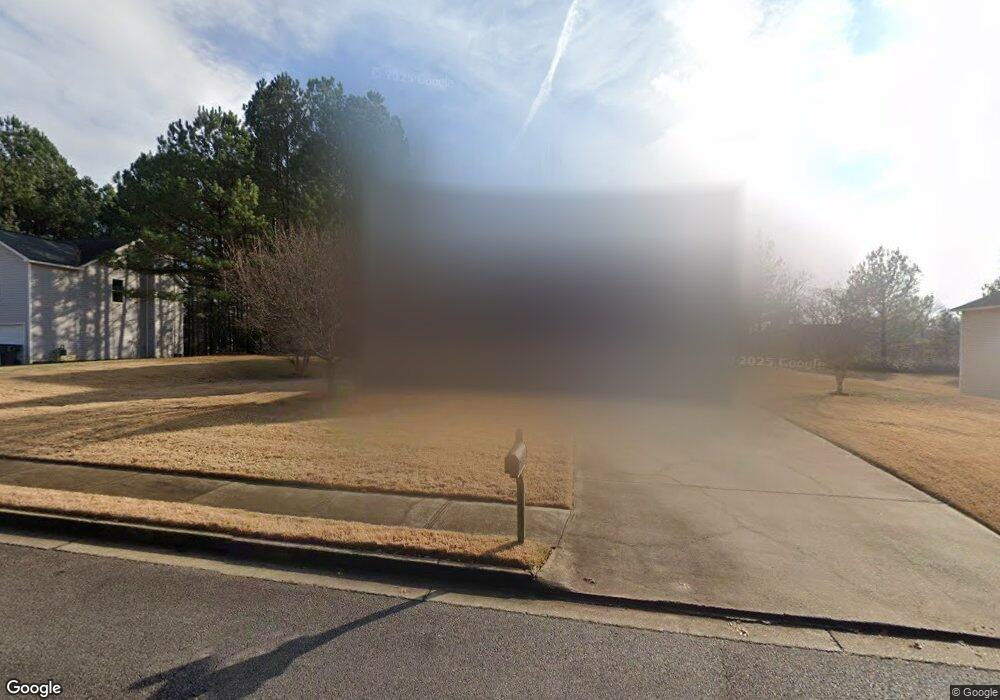
324 Edison Dr Stockbridge, GA 30281
Estimated Value: $354,000 - $363,000
4
Beds
3
Baths
2,958
Sq Ft
$121/Sq Ft
Est. Value
About This Home
This home is located at 324 Edison Dr, Stockbridge, GA 30281 and is currently estimated at $357,770, approximately $120 per square foot. 324 Edison Dr is a home located in Henry County with nearby schools including Cotton Indian Elementary School, Stockbridge Middle School, and Stockbridge High School.
Ownership History
Date
Name
Owned For
Owner Type
Purchase Details
Closed on
Jun 18, 2019
Sold by
Ervin Pamela
Bought by
Ervin Pamela
Current Estimated Value
Purchase Details
Closed on
Mar 31, 2005
Sold by
Homelife Cmntys Henry Inc
Bought by
Ervin Edwin and Ervin Pamela
Home Financials for this Owner
Home Financials are based on the most recent Mortgage that was taken out on this home.
Original Mortgage
$180,700
Interest Rate
5.88%
Mortgage Type
VA
Purchase Details
Closed on
Jan 19, 2005
Sold by
Lexington Park Llc
Bought by
Homelife Communities Henry Inc
Home Financials for this Owner
Home Financials are based on the most recent Mortgage that was taken out on this home.
Original Mortgage
$1,812,400
Interest Rate
5.66%
Create a Home Valuation Report for This Property
The Home Valuation Report is an in-depth analysis detailing your home's value as well as a comparison with similar homes in the area
Home Values in the Area
Average Home Value in this Area
Purchase History
| Date | Buyer | Sale Price | Title Company |
|---|---|---|---|
| Ervin Pamela | -- | -- | |
| Ervin Edwin | $182,200 | -- | |
| Homelife Communities Henry Inc | $426,000 | -- |
Source: Public Records
Mortgage History
| Date | Status | Borrower | Loan Amount |
|---|---|---|---|
| Previous Owner | Ervin Edwin | $180,700 | |
| Previous Owner | Homelife Communities Henry Inc | $1,812,400 |
Source: Public Records
Tax History Compared to Growth
Tax History
| Year | Tax Paid | Tax Assessment Tax Assessment Total Assessment is a certain percentage of the fair market value that is determined by local assessors to be the total taxable value of land and additions on the property. | Land | Improvement |
|---|---|---|---|---|
| 2025 | $4,694 | $139,240 | $14,000 | $125,240 |
| 2024 | $4,694 | $126,120 | $14,000 | $112,120 |
| 2023 | $4,084 | $135,640 | $16,000 | $119,640 |
| 2022 | $4,167 | $106,320 | $10,000 | $96,320 |
| 2021 | $3,320 | $84,240 | $10,000 | $74,240 |
| 2020 | $3,087 | $78,160 | $8,000 | $70,160 |
| 2019 | $2,868 | $72,440 | $8,000 | $64,440 |
| 2018 | $2,484 | $62,440 | $8,000 | $54,440 |
| 2016 | $2,398 | $60,200 | $8,000 | $52,200 |
| 2015 | $2,090 | $50,600 | $6,000 | $44,600 |
| 2014 | $2,028 | $48,440 | $4,800 | $43,640 |
Source: Public Records
Map
Nearby Homes
- 30 Hickory Dr
- 193 Edison Dr
- 277 Edison Dr
- 155 Hickory Dr
- 0 Chimney Smoke Dr Unit 10640945
- 0 Chimney Smoke Dr Unit 182111
- 128 Belair Ln Unit 1
- 1527 Old Conyers Rd Unit 4
- 0 Flakes Rd Unit 24
- 0 Freeman Dr Unit 128 10480940
- 0 Freeman #128 Dr
- 15 Chimney Smoke Dr
- 0 Old Conyers Rd Unit 10574658
- 364 Sound Cir
- 140 Springvalley Cir
- 135 Springvalley Way
- 137 Springvalley Cir
- 566 Knollwood Dr
- 566 Knollwood Dr Unit 2-3
- 153 Springvalley Cir
- 320 Edison Dr
- 328 Edison Dr
- 0 Edison Dr Unit 8063264
- 0 Edison Dr Unit 7059033
- 0 Edison Dr Unit 8955710
- 0 Edison Dr Unit 8745722
- 0 Edison Dr Unit 3100251
- 0 Edison Dr Unit 3150692
- 0 Edison Dr Unit 7584295
- 0 Edison Dr Unit 7584424
- 408 Peterson Dr
- 404 Peterson Dr
- 316 Edison Dr
- 412 Peterson Dr Unit 85
- 412 Peterson Dr
- 325 Edison Dr
- 120 Edison Dr
- 124 Edison Dr
- 329 Edison Dr
- 321 Edison Dr