
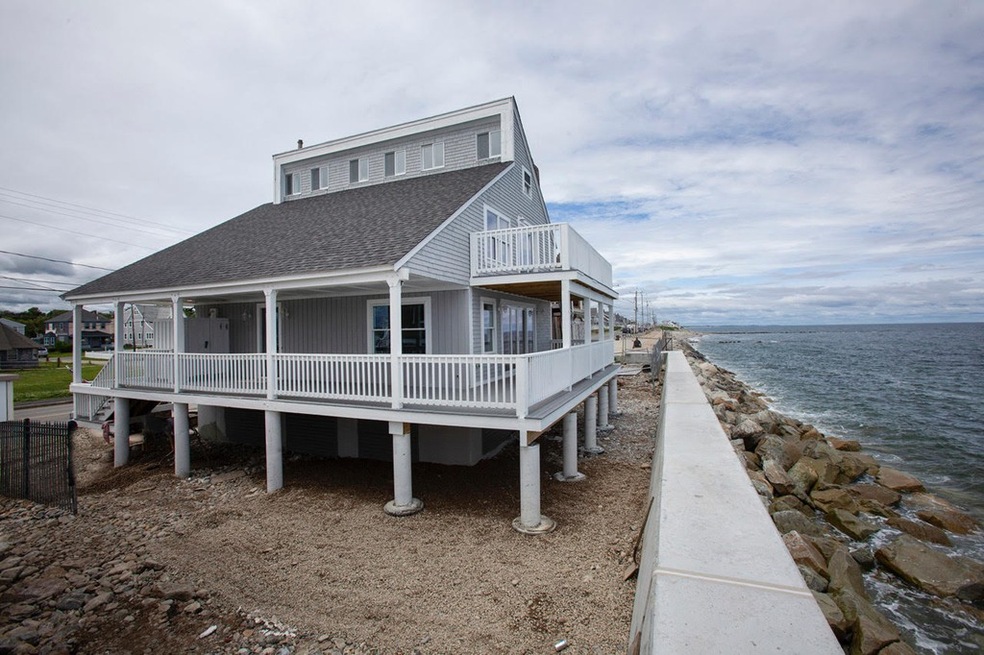
324 Ocean St Marshfield, MA 02050
Ocean Bluff-Brant Rock Neighborhood
3
Beds
2
Baths
1,650
Sq Ft
3,485
Sq Ft Lot
Highlights
- Ocean View
- Covered Deck
- Balcony
- Governor Edward Winslow School Rated A-
- Wood Flooring
- Outdoor Shower
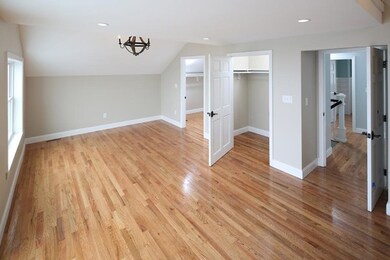
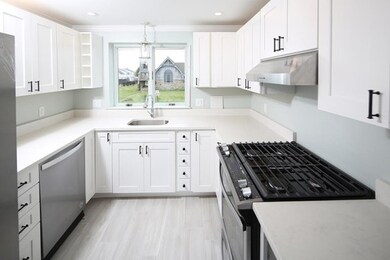
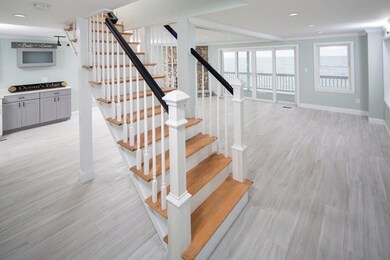
About This Home
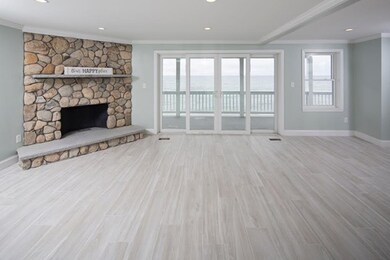
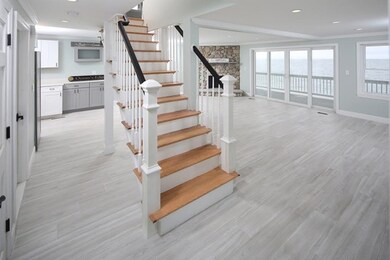
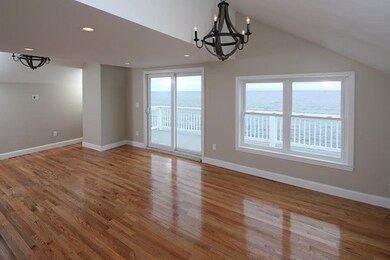
As of November 2019Welcome to Oceans Edge, this custom built direct oceanfront home has been completely remodeled from top to bottom. This light & bright open floor plan is suitable for entertaining w/ fabulous oceanviews, new gourmet white kitchen, new stainless appliances, 2 new full baths, new flooring & doors, new fireplace,new gas furnace,new central air,new electric service,new plumbing,1st floor laundry& freshly painted interior. Exterior features include: new roof, new windows, new sliders, 2 expansive oceanfront decks w/panoramic oceanviews, new outdoor shower, freshly painted exterior and 2 car garage. This unique rare find oceanfront home sits behind a new 8.5 million dollar seawall & has been elevated to comply w/FEMA guidelines & is conveniently located close to Brant Rock Esplanade w/bars, restaurants & shops.Flood ins is $595 per yr per seller & grandfathered.Value Price Range 699-739k
Home Details
Home Type
- Single Family
Est. Annual Taxes
- $10,977
Year Built
- Built in 1979
Lot Details
- Year Round Access
- Property is zoned R-3
Parking
- 2 Car Garage
Property Views
- Ocean Views
Kitchen
- Range
- Dishwasher
Flooring
- Wood
- Tile
Outdoor Features
- Outdoor Shower
- Balcony
- Covered Deck
Utilities
- Forced Air Heating and Cooling System
- Heating System Uses Gas
Listing and Financial Details
- Assessor Parcel Number M:0M08 B:0051 L:0013
Ownership History
Date
Name
Owned For
Owner Type
Purchase Details
Closed on
Aug 14, 2023
Sold by
Monahan Richard
Bought by
Richard Monaham Ret and Monahan
Total Days on Market
105
Current Estimated Value
Purchase Details
Listed on
Oct 18, 2017
Closed on
Sep 25, 2018
Sold by
Acrowley Llc
Bought by
Tah Ft and Worster
Seller's Agent
Amanda Crowley
Grand Gables Realty Group Inc.
Buyer's Agent
Michelle Burt
The Firm
List Price
$350,000
Sold Price
$300,000
Premium/Discount to List
-$50,000
-14.29%
Home Financials for this Owner
Home Financials are based on the most recent Mortgage that was taken out on this home.
Avg. Annual Appreciation
22.39%
Original Mortgage
$400,000
Interest Rate
4.5%
Mortgage Type
New Conventional
Purchase Details
Closed on
Oct 17, 1997
Sold by
John Mchugh T and John Mchugh
Bought by
Campbell Gordon S and Campbell Kim C
Home Financials for this Owner
Home Financials are based on the most recent Mortgage that was taken out on this home.
Original Mortgage
$50,000
Interest Rate
7.46%
Mortgage Type
Purchase Money Mortgage
Map
Create a Home Valuation Report for This Property
The Home Valuation Report is an in-depth analysis detailing your home's value as well as a comparison with similar homes in the area
Similar Homes in Marshfield, MA
Home Values in the Area
Average Home Value in this Area
Purchase History
| Date | Type | Sale Price | Title Company |
|---|---|---|---|
| Quit Claim Deed | -- | None Available | |
| Quit Claim Deed | -- | None Available | |
| Deed | $300,000 | -- | |
| Deed | $300,000 | -- | |
| Deed | $206,150 | -- | |
| Deed | $206,150 | -- |
Source: Public Records
Mortgage History
| Date | Status | Loan Amount | Loan Type |
|---|---|---|---|
| Previous Owner | $530,000 | Stand Alone Refi Refinance Of Original Loan | |
| Previous Owner | $525,000 | New Conventional | |
| Previous Owner | $400,000 | New Conventional | |
| Previous Owner | $50,000 | Purchase Money Mortgage |
Source: Public Records
Property History
| Date | Event | Price | Change | Sq Ft Price |
|---|---|---|---|---|
| 11/12/2019 11/12/19 | Sold | $675,000 | -3.4% | $409 / Sq Ft |
| 10/04/2019 10/04/19 | Pending | -- | -- | -- |
| 09/13/2019 09/13/19 | Price Changed | $699,000 | -6.8% | $424 / Sq Ft |
| 08/21/2019 08/21/19 | Price Changed | $749,900 | 0.0% | $454 / Sq Ft |
| 08/08/2019 08/08/19 | Price Changed | $750,000 | -6.1% | $455 / Sq Ft |
| 07/31/2019 07/31/19 | Price Changed | $799,000 | -4.8% | $484 / Sq Ft |
| 07/19/2019 07/19/19 | Price Changed | $839,000 | -1.2% | $508 / Sq Ft |
| 06/21/2019 06/21/19 | For Sale | $849,000 | +183.0% | $515 / Sq Ft |
| 09/25/2018 09/25/18 | Sold | $300,000 | -14.0% | $184 / Sq Ft |
| 08/25/2018 08/25/18 | Pending | -- | -- | -- |
| 08/16/2018 08/16/18 | Price Changed | $349,000 | -0.3% | $214 / Sq Ft |
| 07/31/2018 07/31/18 | For Sale | $350,000 | 0.0% | $214 / Sq Ft |
| 07/30/2018 07/30/18 | Pending | -- | -- | -- |
| 07/16/2018 07/16/18 | Price Changed | $350,000 | 0.0% | $214 / Sq Ft |
| 07/16/2018 07/16/18 | For Sale | $350,000 | +16.7% | $214 / Sq Ft |
| 03/04/2018 03/04/18 | Off Market | $300,000 | -- | -- |
| 02/27/2018 02/27/18 | For Sale | $649,000 | +116.3% | $398 / Sq Ft |
| 02/24/2018 02/24/18 | Off Market | $300,000 | -- | -- |
| 01/02/2018 01/02/18 | For Sale | $649,000 | 0.0% | $398 / Sq Ft |
| 11/28/2017 11/28/17 | Pending | -- | -- | -- |
| 10/31/2017 10/31/17 | Price Changed | $649,000 | -3.0% | $398 / Sq Ft |
| 10/19/2017 10/19/17 | Price Changed | $669,000 | -0.1% | $410 / Sq Ft |
| 10/18/2017 10/18/17 | For Sale | $669,900 | +65.4% | $410 / Sq Ft |
| 06/16/2017 06/16/17 | Sold | $405,000 | -7.1% | $248 / Sq Ft |
| 05/23/2017 05/23/17 | Pending | -- | -- | -- |
| 05/17/2017 05/17/17 | For Sale | $435,900 | -- | $267 / Sq Ft |
Source: MLS Property Information Network (MLS PIN)
Tax History
| Year | Tax Paid | Tax Assessment Tax Assessment Total Assessment is a certain percentage of the fair market value that is determined by local assessors to be the total taxable value of land and additions on the property. | Land | Improvement |
|---|---|---|---|---|
| 2025 | $10,977 | $1,108,800 | $693,000 | $415,800 |
| 2024 | $10,188 | $980,600 | $610,500 | $370,100 |
| 2023 | $9,540 | $842,800 | $528,000 | $314,800 |
| 2022 | $8,477 | $654,600 | $387,800 | $266,800 |
| 2021 | $8,410 | $637,600 | $387,800 | $249,800 |
| 2020 | $7,695 | $577,300 | $363,000 | $214,300 |
| 2019 | $7,509 | $561,200 | $363,000 | $198,200 |
| 2018 | $7,198 | $538,400 | $363,000 | $175,400 |
| 2017 | $6,990 | $509,500 | $363,000 | $146,500 |
| 2016 | $7,072 | $509,500 | $363,000 | $146,500 |
| 2015 | $7,496 | $564,000 | $429,000 | $135,000 |
| 2014 | $7,538 | $567,200 | $429,000 | $138,200 |
Source: Public Records
Source: MLS Property Information Network (MLS PIN)
MLS Number: 72523520
APN: MARS-000008M-000051-000013
Disclaimer: Certain information contained herein is derived from information provided by parties other than Homes.com. All information provided is deemed reliable, but is not guaranteed to be accurate and should be independently verified.
![]() The property listing data and information, or the Images, set forth herein were provided to MLS Property Information Network, Inc. from third party sources, including sellers, lessors and public records, and were compiled by MLS Property Information Network, Inc. The property listing data and information, and the Images, are for the personal, non-commercial use of consumers having a good faith interest in purchasing or leasing listed properties of the type displayed to them and may not be used for any purpose other than to identify prospective properties which such consumers may have a good faith interest in purchasing or leasing. MLS Property Information Network, Inc. and its subscribers disclaim any and all representations and warranties as to the accuracy of the property listing data and information, or as to the accuracy of any of the Images, set forth herein.
The property listing data and information, or the Images, set forth herein were provided to MLS Property Information Network, Inc. from third party sources, including sellers, lessors and public records, and were compiled by MLS Property Information Network, Inc. The property listing data and information, and the Images, are for the personal, non-commercial use of consumers having a good faith interest in purchasing or leasing listed properties of the type displayed to them and may not be used for any purpose other than to identify prospective properties which such consumers may have a good faith interest in purchasing or leasing. MLS Property Information Network, Inc. and its subscribers disclaim any and all representations and warranties as to the accuracy of the property listing data and information, or as to the accuracy of any of the Images, set forth herein.
Nearby Homes