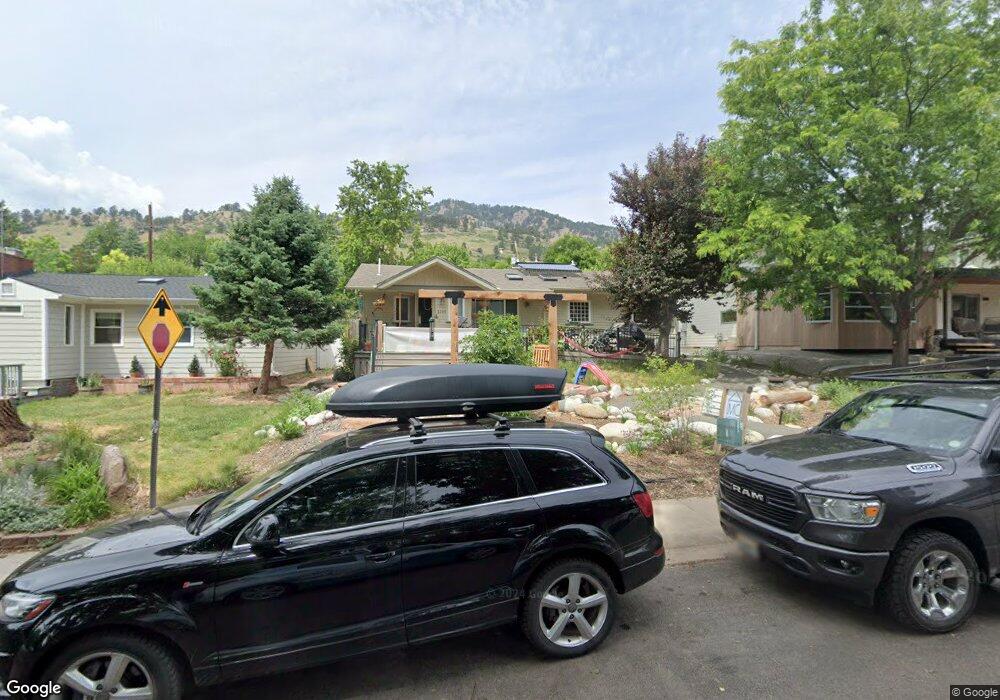
3245 6th St Boulder, CO 80304
Newlands NeighborhoodEstimated Value: $1,129,256 - $1,426,000
3
Beds
2
Baths
2,060
Sq Ft
$654/Sq Ft
Est. Value
About This Home
This home is located at 3245 6th St, Boulder, CO 80304 and is currently estimated at $1,346,814, approximately $653 per square foot. 3245 6th St is a home located in Boulder County with nearby schools including Foothill Elementary School, Casey Middle School, and Boulder High School.
Ownership History
Date
Name
Owned For
Owner Type
Purchase Details
Closed on
Jul 30, 1987
Bought by
Brooks Anne
Current Estimated Value
Purchase Details
Closed on
Feb 4, 1986
Bought by
Brooks Anne
Purchase Details
Closed on
May 31, 1977
Bought by
Brooks Anne
Create a Home Valuation Report for This Property
The Home Valuation Report is an in-depth analysis detailing your home's value as well as a comparison with similar homes in the area
Home Values in the Area
Average Home Value in this Area
Purchase History
| Date | Buyer | Sale Price | Title Company |
|---|---|---|---|
| Brooks Anne | $93,900 | -- | |
| Brooks Anne | -- | -- | |
| Brooks Anne | $54,500 | -- |
Source: Public Records
Tax History
| Year | Tax Paid | Tax Assessment Tax Assessment Total Assessment is a certain percentage of the fair market value that is determined by local assessors to be the total taxable value of land and additions on the property. | Land | Improvement |
|---|---|---|---|---|
| 2025 | $7,405 | $97,337 | $84,506 | $12,831 |
| 2024 | $7,405 | $97,337 | $84,506 | $12,831 |
| 2023 | $7,405 | $85,747 | $80,488 | $8,943 |
| 2022 | $6,821 | $73,454 | $66,109 | $7,345 |
| 2021 | $6,505 | $75,569 | $68,012 | $7,557 |
| 2020 | $6,013 | $69,077 | $55,270 | $13,807 |
| 2019 | $5,921 | $69,077 | $55,270 | $13,807 |
| 2018 | $5,134 | $59,220 | $47,376 | $11,844 |
| 2017 | $4,974 | $65,472 | $52,377 | $13,095 |
| 2016 | $5,167 | $59,684 | $40,835 | $18,849 |
| 2015 | $4,892 | $44,544 | $19,343 | $25,201 |
| 2014 | $3,745 | $44,544 | $19,343 | $25,201 |
Source: Public Records
Map
Nearby Homes
- 640 Iris Ave
- 711 Hawthorn Ave
- 521 Hawthorn Ave
- 503 Hawthorn Ave
- 865 Grape Ave Unit X
- 656 Juniper Ave
- 3189 5th St
- 706 Juniper Ave
- 440 Japonica Way
- 501 Evergreen Ave
- 300 Forest Ave
- 1023 Forest Ave
- 1070 Juniper Ave
- 3056 8th St
- 3135 11th St
- 3315 Broadway St
- 3319 Broadway
- 497 Kalmia Ave
- 503 Kalmia Ave
- 2958 6th St
Your Personal Tour Guide
Ask me questions while you tour the home.