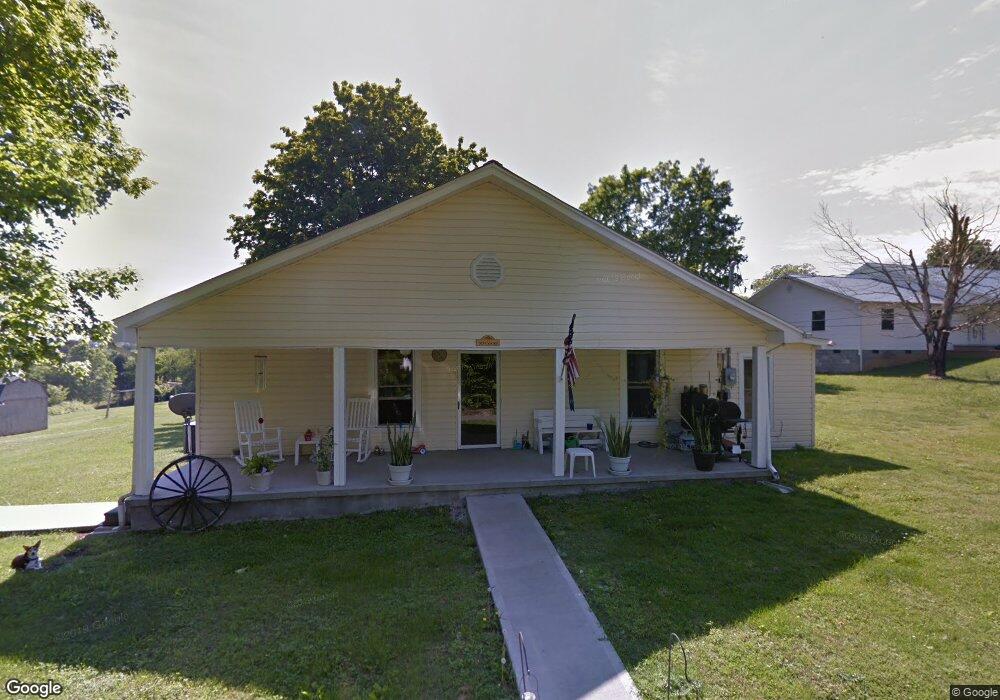
325 Carr Rd Seymour, TN 37865
Estimated Value: $264,000 - $332,000
--
Bed
1
Bath
1,496
Sq Ft
$201/Sq Ft
Est. Value
About This Home
This home is located at 325 Carr Rd, Seymour, TN 37865 and is currently estimated at $301,309, approximately $201 per square foot. 325 Carr Rd is a home located in Blount County with nearby schools including Prospect Elementary School, Heritage Middle School, and Heritage High School.
Ownership History
Date
Name
Owned For
Owner Type
Purchase Details
Closed on
Sep 20, 2021
Sold by
Mancini Rachel
Bought by
Mancini Steven
Current Estimated Value
Purchase Details
Closed on
May 8, 2020
Sold by
Collins Jonnie Lee
Bought by
Mancini Steven and Mancini Rachel
Home Financials for this Owner
Home Financials are based on the most recent Mortgage that was taken out on this home.
Original Mortgage
$104,000
Interest Rate
3.5%
Mortgage Type
New Conventional
Purchase Details
Closed on
Oct 4, 2019
Sold by
Collins Carla Ann
Bought by
Collins Jonnie Lee
Purchase Details
Closed on
Sep 3, 2010
Sold by
Collins Jonnie L
Bought by
Collins Jonnie
Purchase Details
Closed on
Mar 2, 2005
Sold by
Deutsche National Trust
Bought by
Cummings Rudy
Purchase Details
Closed on
Aug 27, 2004
Bought by
Deutsche Bank National
Purchase Details
Closed on
Aug 8, 1995
Bought by
Trentham Vincent L
Purchase Details
Closed on
May 17, 1960
Bought by
Trentham Carl and Trentham Hazel L
Create a Home Valuation Report for This Property
The Home Valuation Report is an in-depth analysis detailing your home's value as well as a comparison with similar homes in the area
Home Values in the Area
Average Home Value in this Area
Purchase History
| Date | Buyer | Sale Price | Title Company |
|---|---|---|---|
| Mancini Steven | -- | -- | |
| Mancini Steven | $130,000 | -- | |
| Collins Jonnie Lee | -- | -- | |
| Collins Jonnie | -- | -- | |
| Cummings Rudy | $70,000 | -- | |
| Deutsche Bank National | $82,100 | -- | |
| Trentham Vincent L | $9,000 | -- | |
| Trentham Carl | -- | -- |
Source: Public Records
Mortgage History
| Date | Status | Borrower | Loan Amount |
|---|---|---|---|
| Previous Owner | Mancini Steven | $104,000 |
Source: Public Records
Tax History Compared to Growth
Tax History
| Year | Tax Paid | Tax Assessment Tax Assessment Total Assessment is a certain percentage of the fair market value that is determined by local assessors to be the total taxable value of land and additions on the property. | Land | Improvement |
|---|---|---|---|---|
| 2025 | $843 | $53,025 | $0 | $0 |
| 2024 | $843 | $53,025 | $8,425 | $44,600 |
| 2023 | $852 | $53,025 | $8,425 | $44,600 |
| 2022 | $744 | $30,125 | $6,550 | $23,575 |
| 2021 | $744 | $30,125 | $6,550 | $23,575 |
| 2020 | $744 | $30,125 | $6,550 | $23,575 |
| 2019 | $744 | $30,125 | $6,550 | $23,575 |
| 2018 | $713 | $28,850 | $6,450 | $22,400 |
| 2017 | $713 | $28,850 | $6,450 | $22,400 |
| 2016 | $713 | $28,850 | $6,450 | $22,400 |
| 2015 | $620 | $28,850 | $6,450 | $22,400 |
| 2014 | $592 | $28,850 | $6,450 | $22,400 |
| 2013 | $592 | $27,525 | $0 | $0 |
Source: Public Records
Map
Nearby Homes
- 5925 Sevierville Rd
- 237 Westmoreland Ct
- 205 Blue Ridge Ln
- 116 Blue Ridge Ln
- 521 Devon St
- 1506 Cunningham Rd W
- 715 Winston Dr
- 516 Keck St
- 830 Easey St
- 534 Tennessee Cir
- 706 Paso Trail Way
- 516 Cherokee Hills Rd
- 0 Burns Ln
- 123 Colonial Cir
- 401 Burns Ln
- 269 Mohawk Cir
- 408 Winners Cir
- 372 Overlook Dr
- 1040 Pathways Dr
- 634 Crestview Ct
- 329 Carr Rd
- 323 Carr Rd
- 322 Carr Rd
- 317 Carr Rd
- 316 Carr Rd
- 1071 Towns View Dr
- 243 Carr Rd
- 115 Gray Squirrel Ln
- 113 Gray Squirrel Ln Unit 115
- 1065 Towns View Dr
- 109 Gray Squirrel Ln Unit 111
- 111 Gray Squirrel Ln Unit 109
- 117 Gray Squirrel Ln Unit 119
- 108 Gray Squirrel Ln Unit 110
- 1066 Towns View Dr
- 1057 Towns View Dr
- 1064 Towns View Dr
- 262 Keener Rd
- 0 Gray Squirrel Ln
- 229 Carr Rd