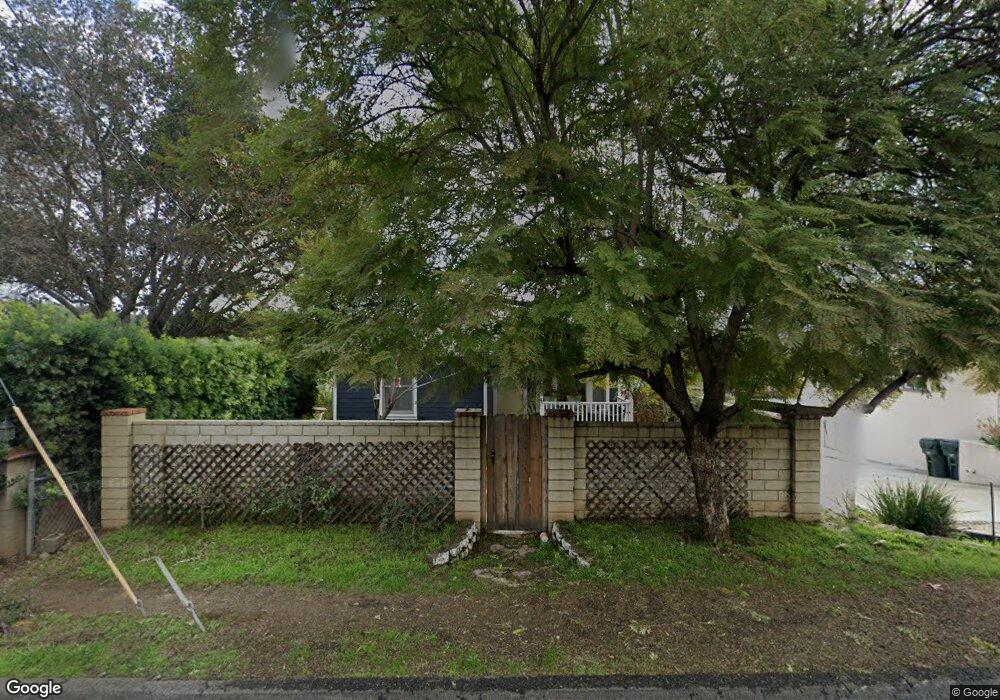
325 E Fallbrook St Fallbrook, CA 92028
Estimated Value: $546,000 - $668,595
4
Beds
1
Bath
1,344
Sq Ft
$444/Sq Ft
Est. Value
About This Home
This home is located at 325 E Fallbrook St, Fallbrook, CA 92028 and is currently estimated at $596,649, approximately $443 per square foot. 325 E Fallbrook St is a home located in San Diego County with nearby schools including La Paloma Elementary School, James E. Potter Intermediate School, and Fallbrook High School.
Ownership History
Date
Name
Owned For
Owner Type
Purchase Details
Closed on
Sep 28, 2009
Sold by
Oerding Rhonda Renee
Bought by
Obrien Matthew J and Obrien Richard J
Current Estimated Value
Home Financials for this Owner
Home Financials are based on the most recent Mortgage that was taken out on this home.
Original Mortgage
$167,910
Outstanding Balance
$109,306
Interest Rate
5.02%
Mortgage Type
FHA
Estimated Equity
$487,343
Purchase Details
Closed on
Jun 15, 2009
Sold by
Oerding Rhonda Renee
Bought by
Oerding Rhonda Renee
Purchase Details
Closed on
May 8, 2009
Sold by
Seely Philip Charles
Bought by
Oerding Rhonda Renee
Purchase Details
Closed on
Mar 22, 2008
Sold by
Qualls Lloyd G
Bought by
Seely Philip Charles
Purchase Details
Closed on
Jan 31, 2003
Sold by
Qualls Lloyd G
Bought by
Qualls Lloyd G
Create a Home Valuation Report for This Property
The Home Valuation Report is an in-depth analysis detailing your home's value as well as a comparison with similar homes in the area
Home Values in the Area
Average Home Value in this Area
Purchase History
| Date | Buyer | Sale Price | Title Company |
|---|---|---|---|
| Obrien Matthew J | $174,000 | Lawyers Title Insurance Co | |
| Oerding Rhonda Renee | -- | Lawyers Title | |
| Oerding Rhonda Renee | -- | Lawyers Title | |
| Seely Philip Charles | -- | None Available | |
| Qualls Lloyd G | -- | -- |
Source: Public Records
Mortgage History
| Date | Status | Borrower | Loan Amount |
|---|---|---|---|
| Open | Obrien Matthew J | $167,910 |
Source: Public Records
Tax History
| Year | Tax Paid | Tax Assessment Tax Assessment Total Assessment is a certain percentage of the fair market value that is determined by local assessors to be the total taxable value of land and additions on the property. | Land | Improvement |
|---|---|---|---|---|
| 2025 | $2,401 | $233,514 | $99,816 | $133,698 |
| 2024 | $2,401 | $228,936 | $97,859 | $131,077 |
| 2023 | $2,336 | $224,448 | $95,941 | $128,507 |
| 2022 | $2,335 | $220,048 | $94,060 | $125,988 |
| 2021 | $2,261 | $215,734 | $92,216 | $123,518 |
| 2020 | $2,280 | $213,523 | $91,271 | $122,252 |
| 2019 | $2,151 | $201,337 | $89,482 | $111,855 |
| 2018 | $2,133 | $197,390 | $87,728 | $109,662 |
| 2017 | $2,151 | $193,520 | $86,008 | $107,512 |
| 2016 | $2,097 | $189,726 | $84,322 | $105,404 |
| 2015 | $2,057 | $186,877 | $83,056 | $103,821 |
| 2014 | $2,019 | $183,218 | $81,430 | $101,788 |
Source: Public Records
Map
Nearby Homes
- 522 S Pico Ave
- 1024 Kiel Rd
- 508 Village View Place
- 210 S Orange Ave
- 502 E Elder St
- 535 Shady Glen Dr
- 741 Rossiter Ln
- 206 Via Oro Verde
- 214 Summit Ave
- 0 Via Vonnie Unit SW26054903
- 868 E Alvarado St Unit 7
- 868 E Alvarado St Unit 47
- 408 N Pico Ave
- 956 Woodcreek Rd
- 1003 Via Unidos
- 445 Poets Square
- 678 Robby Way
- 113 Gardenside Ct
- 903 Crescent Bend
- 832 Magarian Rd
- 317 E Fallbrook St
- 333 E Fallbrook St
- 722 Old Stage Rd
- 710 Old Stage Rd
- 734 Old Stage Rd
- 318 E Fallbrook St
- 302-338 E Fallbrook St
- 701 Old Stage Rd
- 330 E Fallbrook St Unit 38
- 338 Old Stage Ct
- 326 Old Stage Ct
- 350 Old Stage Ct
- 725 Old Stage Rd
- 314 Old Stage Ct
- 362 Old Stage Ct
- 374 Old Stage Ct
- 717 Old Stage Rd
- 302 E Fallbrook St
- 302 E Fallbrook St Unit 22
- 240 E Fallbrook St
Your Personal Tour Guide
Ask me questions while you tour the home.