Estimated Value: $134,000 - $160,000
Studio
--
Bath
1,344
Sq Ft
$107/Sq Ft
Est. Value
About This Home
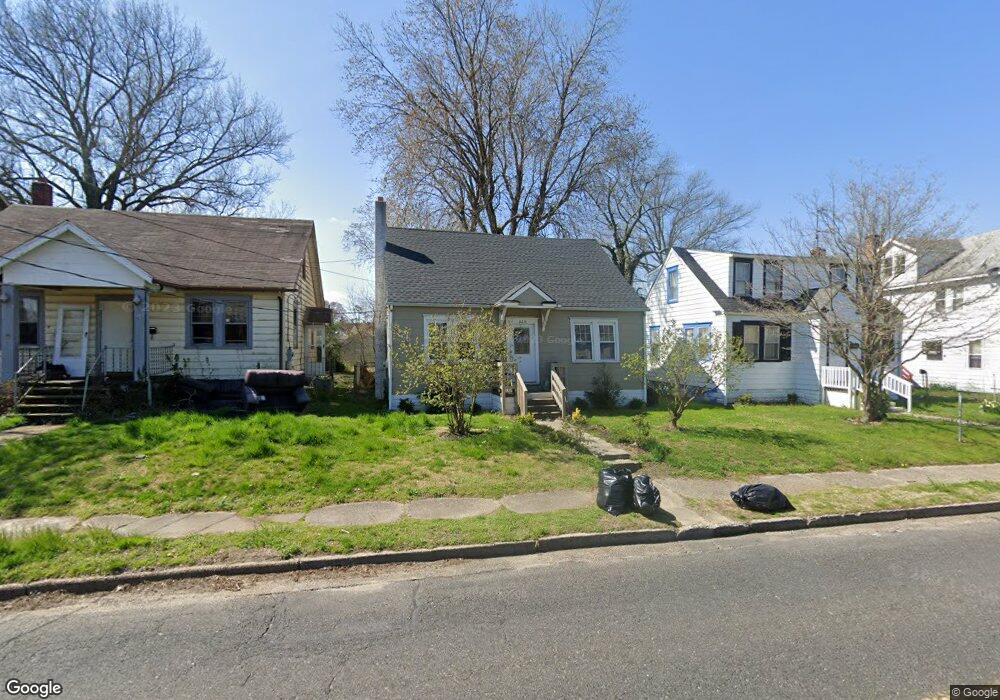
This home is located at 325 Grant St, Salem, NJ 08079 and is currently estimated at $143,560, approximately $106 per square foot. 325 Grant St is a home located in Salem County with nearby schools including John Fenwick Elementary School, Salem Middle School, and Salem High School.
Ownership History
Date
Name
Owned For
Owner Type
Purchase Details
Closed on
Dec 23, 2014
Sold by
Humphereys Mark D
Bought by
Pine Island Meadows
Current Estimated Value
Purchase Details
Closed on
May 6, 2005
Sold by
Myers Harry S
Bought by
Fuse William G and Fuse Claudia D
Purchase Details
Closed on
Nov 25, 1998
Sold by
Federal National Mortgage Association
Bought by
Myers Harry S and Myers Eva M
Purchase Details
Closed on
May 8, 1998
Sold by
Dewald Denise and Deepwater Industries Fcu
Bought by
Federal National Mortgage Association
Purchase Details
Closed on
Oct 29, 1993
Sold by
Liable John C
Bought by
Dewald Dennis M
Home Financials for this Owner
Home Financials are based on the most recent Mortgage that was taken out on this home.
Original Mortgage
$57,000
Interest Rate
6.83%
Create a Home Valuation Report for This Property
The Home Valuation Report is an in-depth analysis detailing your home's value as well as a comparison with similar homes in the area
Home Values in the Area
Average Home Value in this Area
Purchase History
| Date | Buyer | Sale Price | Title Company |
|---|---|---|---|
| Pine Island Meadows | -- | None Available | |
| Fuse William G | $58,000 | Salem Oak Title Agency Inc | |
| Myers Harry S | $38,000 | Congress Title Corp | |
| Federal National Mortgage Association | -- | -- | |
| Dewald Dennis M | $60,000 | -- |
Source: Public Records
Mortgage History
| Date | Status | Borrower | Loan Amount |
|---|---|---|---|
| Previous Owner | Dewald Dennis M | $57,000 |
Source: Public Records
Tax History
| Year | Tax Paid | Tax Assessment Tax Assessment Total Assessment is a certain percentage of the fair market value that is determined by local assessors to be the total taxable value of land and additions on the property. | Land | Improvement |
|---|---|---|---|---|
| 2025 | $3,881 | $47,200 | $12,900 | $34,300 |
| 2024 | $3,710 | $47,200 | $12,900 | $34,300 |
Source: Public Records
Map
Nearby Homes
Your Personal Tour Guide
Ask me questions while you tour the home.