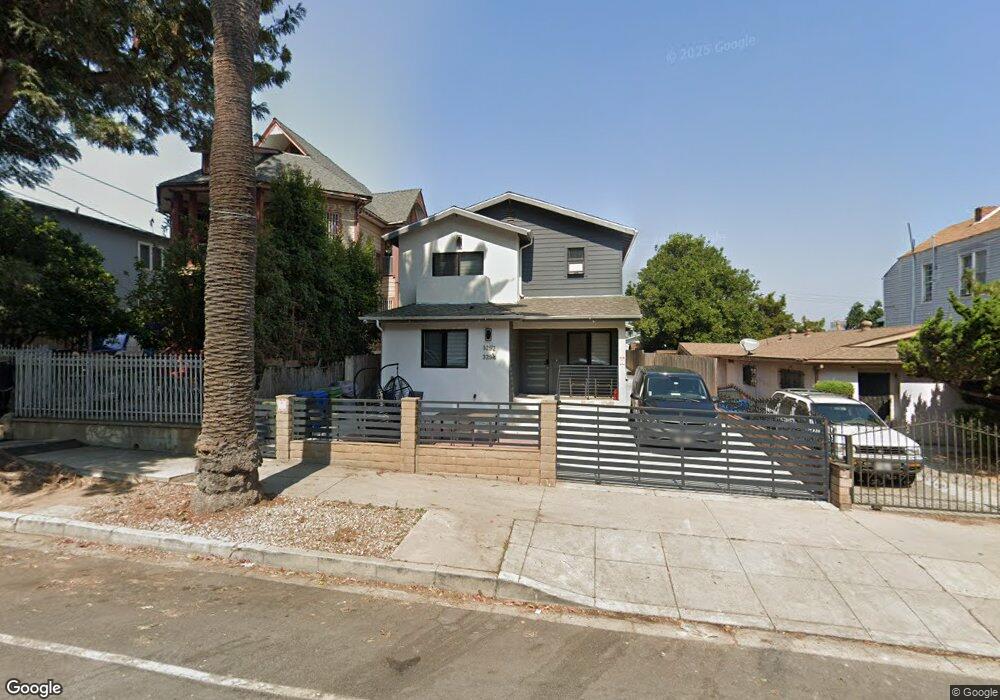
325 N Union Ave Unit 3/4 Los Angeles, CA 90026
Westlake NeighborhoodEstimated Value: $933,000 - $2,951,000
4
Beds
5
Baths
1,720
Sq Ft
$1,222/Sq Ft
Est. Value
About This Home
This home is located at 325 N Union Ave Unit 3/4, Los Angeles, CA 90026 and is currently estimated at $2,102,226, approximately $1,222 per square foot. 325 N Union Ave Unit 3/4 is a home located in Los Angeles County with nearby schools including Sal Castro Middle School, Belmont High School, and Academic Leadership Community Miguel Contreras Learning Complex.
Ownership History
Date
Name
Owned For
Owner Type
Purchase Details
Closed on
Feb 27, 2020
Sold by
Kim Young
Bought by
Lee Jung Ah
Current Estimated Value
Home Financials for this Owner
Home Financials are based on the most recent Mortgage that was taken out on this home.
Original Mortgage
$1,495,000
Outstanding Balance
$1,324,036
Interest Rate
3.5%
Mortgage Type
Purchase Money Mortgage
Estimated Equity
$778,190
Purchase Details
Closed on
Sep 5, 2019
Sold by
Hesby Expert Llc
Bought by
Lee Jung Ah
Purchase Details
Closed on
Jun 12, 2018
Sold by
Sanchez John R
Bought by
Hesby Expert Llc
Purchase Details
Closed on
Feb 11, 2005
Sold by
Sanchez John R and Sanchez Bernard
Bought by
Sanchez John R
Purchase Details
Closed on
Oct 24, 2002
Sold by
Sanchez Carlotta P and Sanchez John R
Bought by
Sanchez Carlotta P
Purchase Details
Closed on
Oct 6, 1993
Sold by
Sanchez Carlotta P
Bought by
Sanchez Carlotta P
Create a Home Valuation Report for This Property
The Home Valuation Report is an in-depth analysis detailing your home's value as well as a comparison with similar homes in the area
Home Values in the Area
Average Home Value in this Area
Purchase History
| Date | Buyer | Sale Price | Title Company |
|---|---|---|---|
| Lee Jung Ah | -- | Provident Title Company | |
| Lee Jung Ah | $2,300,000 | Provident Title Company | |
| Hesby Expert Llc | $700,000 | Fidelity National Title Comp | |
| Sanchez John R | -- | -- | |
| Sanchez Carlotta P | -- | -- | |
| Sanchez Carlotta P | -- | -- |
Source: Public Records
Mortgage History
| Date | Status | Borrower | Loan Amount |
|---|---|---|---|
| Open | Lee Jung Ah | $1,495,000 |
Source: Public Records
Tax History Compared to Growth
Tax History
| Year | Tax Paid | Tax Assessment Tax Assessment Total Assessment is a certain percentage of the fair market value that is determined by local assessors to be the total taxable value of land and additions on the property. | Land | Improvement |
|---|---|---|---|---|
| 2025 | $30,203 | $2,515,382 | $1,531,102 | $984,280 |
| 2024 | $30,203 | $2,466,062 | $1,501,081 | $964,981 |
| 2023 | $29,619 | $2,417,709 | $1,471,649 | $946,060 |
| 2022 | $28,243 | $2,370,304 | $1,442,794 | $927,510 |
| 2021 | $27,882 | $2,323,828 | $1,414,504 | $909,324 |
| 2020 | $16,306 | $1,314,400 | $571,200 | $743,200 |
| 2019 | $8,520 | $700,000 | $560,000 | $140,000 |
| 2018 | $818 | $49,073 | $33,369 | $15,704 |
| 2016 | $768 | $47,170 | $32,074 | $15,096 |
| 2015 | $759 | $46,463 | $31,593 | $14,870 |
| 2014 | $775 | $45,554 | $30,975 | $14,579 |
Source: Public Records
Map
Nearby Homes
- 333 N Union Ave
- 334 Belmont Ave
- 251 N Burlington Ave
- 1272 1276 W Court St
- 234 N Burlington Ave
- 1727 Bellevue Ave
- 606 N Bonnie Brae St
- 125 N Mountain View Ave
- 2005 Bellevue Ave
- 2007 Bellevue Ave
- 616 N Alvarado St
- 1415 W Court St
- 647 Laveta Terrace
- 1660 W 2nd St
- 341 Douglas St
- 1741 Kent St
- 142 S Mountain View Ave
- 1120 W Edgeware Rd
- 151 S Mountain View Ave
- 146 Rosemont Ave
- 325 N Union Ave
- 321 N Union Ave
- 327 N Union Ave
- 317 N Union Ave
- 337 N Union Ave
- 313 N Union Ave
- 343 N Union Ave
- 324 N Burlington Ave
- 334 N Union Ave
- 320 N Burlington Ave
- 328 N Burlington Ave
- 1710 W Temple St
- 316 N Burlington Ave
- 312 N Burlington Ave
- 333 Belmont Ave Unit 412
- 333 Belmont Ave Unit 411
- 333 Belmont Ave Unit 410
- 333 Belmont Ave Unit 409
- 333 Belmont Ave Unit 405