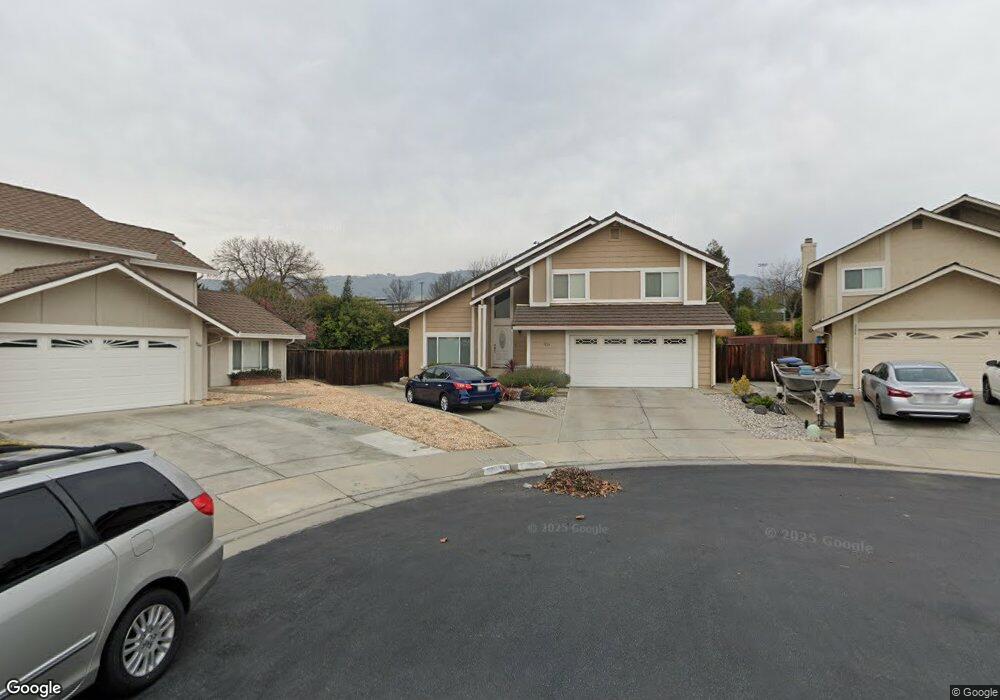
3257 Sprucegate Ct San Jose, CA 95148
Heritage NeighborhoodEstimated Value: $1,799,000 - $1,959,507
3
Beds
3
Baths
2,009
Sq Ft
$931/Sq Ft
Est. Value
About This Home
This home is located at 3257 Sprucegate Ct, San Jose, CA 95148 and is currently estimated at $1,869,877, approximately $930 per square foot. 3257 Sprucegate Ct is a home located in Santa Clara County with nearby schools including Millbrook Elementary School, Quimby Oak Middle School, and Evergreen Valley High School.
Ownership History
Date
Name
Owned For
Owner Type
Purchase Details
Closed on
Jul 5, 2016
Sold by
Lee Chris Tzuchun and Yeh Catherine Yann Ming
Bought by
The Lee & Yeh Family Trust and Yeh Catherine Yann Ming
Current Estimated Value
Home Financials for this Owner
Home Financials are based on the most recent Mortgage that was taken out on this home.
Original Mortgage
$442,000
Outstanding Balance
$278,472
Interest Rate
3.64%
Mortgage Type
New Conventional
Estimated Equity
$1,591,405
Purchase Details
Closed on
Oct 13, 2013
Sold by
Lee Chris Tzuchun and Yeh Catherine Yann Ming
Bought by
Lee Chris Tzuchun and Yeh Catherine Yann Ming
Purchase Details
Closed on
Mar 11, 2006
Sold by
Wall Lionel Robert and Wall Rhonda Kaye
Bought by
Lee Tzuchun and Yeh Catherine
Home Financials for this Owner
Home Financials are based on the most recent Mortgage that was taken out on this home.
Original Mortgage
$520,000
Interest Rate
6.25%
Mortgage Type
Purchase Money Mortgage
Create a Home Valuation Report for This Property
The Home Valuation Report is an in-depth analysis detailing your home's value as well as a comparison with similar homes in the area
Home Values in the Area
Average Home Value in this Area
Purchase History
| Date | Buyer | Sale Price | Title Company |
|---|---|---|---|
| The Lee & Yeh Family Trust | -- | Old Republic Title Company | |
| Lee Chris Tzuchun | -- | Old Republic Title Company | |
| Lee Chris Tzuchun | -- | None Available | |
| Lee Tzuchun | $820,000 | Stewart Title Of Ca Inc |
Source: Public Records
Mortgage History
| Date | Status | Borrower | Loan Amount |
|---|---|---|---|
| Open | Lee Chris Tzuchun | $442,000 | |
| Closed | Lee Tzuchun | $520,000 |
Source: Public Records
Tax History Compared to Growth
Tax History
| Year | Tax Paid | Tax Assessment Tax Assessment Total Assessment is a certain percentage of the fair market value that is determined by local assessors to be the total taxable value of land and additions on the property. | Land | Improvement |
|---|---|---|---|---|
| 2025 | $15,612 | $1,120,582 | $672,351 | $448,231 |
| 2024 | $15,612 | $1,098,611 | $659,168 | $439,443 |
| 2023 | $15,325 | $1,077,071 | $646,244 | $430,827 |
| 2022 | $15,180 | $1,055,953 | $633,573 | $422,380 |
| 2021 | $14,942 | $1,035,249 | $621,150 | $414,099 |
| 2020 | $14,305 | $1,024,634 | $614,781 | $409,853 |
| 2019 | $13,955 | $1,004,544 | $602,727 | $401,817 |
| 2018 | $13,841 | $984,848 | $590,909 | $393,939 |
| 2017 | $13,622 | $965,538 | $579,323 | $386,215 |
| 2016 | $12,988 | $946,607 | $567,964 | $378,643 |
| 2015 | $11,832 | $854,000 | $512,400 | $341,600 |
| 2014 | $10,341 | $781,000 | $468,600 | $312,400 |
Source: Public Records
Map
Nearby Homes
- 3123 Oakgate Way
- 3198 Vintage Crest Dr
- 3508 Casabella Ct
- 3422 Glenprosen Ct
- 3145 Chillum Ct
- 3430 Maroun Place
- 3114 Pinot Grigio Place
- 2896 Rathmann Dr
- 2885 Mantis Dr
- 2886 Damico Dr
- 2859 Broken Oak Ct
- 3344 Quesada Dr
- 2930 Silverland Ct
- 2837 Mantis Dr
- 3626 Norcross Ct
- 2847 Norcrest Dr
- 2715 Sugarplum Dr
- 2707 Sugarplum Dr
- 2604 Bon Dr
- 2955 Vineyard Park Dr
- 3249 Sprucegate Ct
- 3256 Sprucegate Ct
- 3241 Sprucegate Ct
- 3248 Sprucegate Ct
- 3238 Fieldgate Ct
- 3240 Sprucegate Ct
- 3233 Sprucegate Ct
- 3246 Fieldgate Ct
- 3267 Pinegate Way
- 3232 Sprucegate Ct
- 3259 Pinegate Way
- 3230 Fieldgate Ct
- 3243 Pinegate Way
- 3225 Sprucegate Ct
- 3235 Pinegate Way
- 3224 Sprucegate Ct
- 3247 Fieldgate Ct
- 3222 Fieldgate Ct
- 3227 Pinegate Way
- 3217 Sprucegate Ct