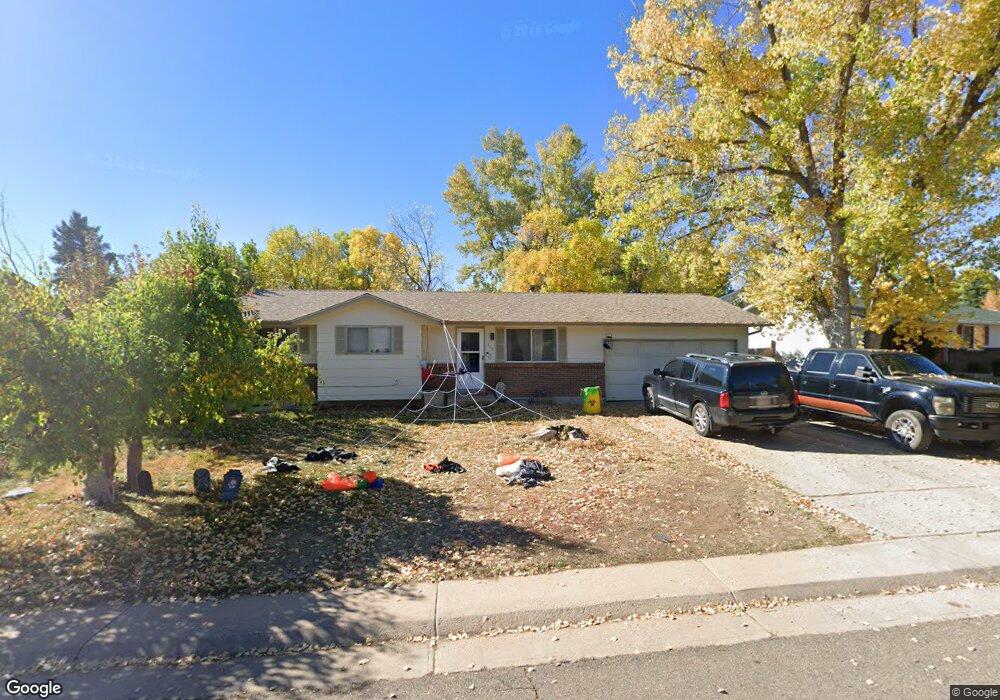
326 Aquarius Ct Littleton, CO 80124
Estimated Value: $509,000 - $550,000
4
Beds
2
Baths
1,935
Sq Ft
$275/Sq Ft
Est. Value
About This Home
This home is located at 326 Aquarius Ct, Littleton, CO 80124 and is currently estimated at $532,026, approximately $274 per square foot. 326 Aquarius Ct is a home located in Douglas County with nearby schools including Acres Green Elementary School, Cresthill Middle School, and Highlands Ranch High School.
Ownership History
Date
Name
Owned For
Owner Type
Purchase Details
Closed on
Jul 7, 2021
Sold by
Hpa Ii Borrower 2020 1 Ml Llc
Bought by
Bruce Angele and Fay Adam
Current Estimated Value
Home Financials for this Owner
Home Financials are based on the most recent Mortgage that was taken out on this home.
Original Mortgage
$445,874
Outstanding Balance
$404,562
Interest Rate
2.9%
Mortgage Type
FHA
Estimated Equity
$127,464
Purchase Details
Closed on
Mar 10, 2020
Sold by
Hpa Us1 Llc
Bought by
Hpa Ii Borrower 2020 1 Ml Llc
Purchase Details
Closed on
Aug 30, 2019
Sold by
Harvey Gary E
Bought by
Hpa Us1 Llc
Purchase Details
Closed on
Nov 30, 1984
Sold by
Herron Michael T and Herron Nancy D
Bought by
Harvey Gary E
Purchase Details
Closed on
Feb 28, 1983
Sold by
Kilgore Edmund G
Bought by
Herron Micheal T and Herron Nancy D
Create a Home Valuation Report for This Property
The Home Valuation Report is an in-depth analysis detailing your home's value as well as a comparison with similar homes in the area
Home Values in the Area
Average Home Value in this Area
Purchase History
| Date | Buyer | Sale Price | Title Company |
|---|---|---|---|
| Bruce Angele | $454,100 | Realtech Title Llc | |
| Hpa Ii Borrower 2020 1 Ml Llc | -- | None Available | |
| Hpa Us1 Llc | $387,500 | Stewart Title | |
| Harvey Gary E | $81,500 | -- | |
| Herron Micheal T | $77,900 | -- |
Source: Public Records
Mortgage History
| Date | Status | Borrower | Loan Amount |
|---|---|---|---|
| Open | Bruce Angele | $445,874 |
Source: Public Records
Tax History Compared to Growth
Tax History
| Year | Tax Paid | Tax Assessment Tax Assessment Total Assessment is a certain percentage of the fair market value that is determined by local assessors to be the total taxable value of land and additions on the property. | Land | Improvement |
|---|---|---|---|---|
| 2024 | $3,660 | $39,250 | $7,550 | $31,700 |
| 2023 | $3,297 | $39,250 | $7,550 | $31,700 |
| 2022 | $2,448 | $27,490 | $6,410 | $21,080 |
| 2021 | $2,546 | $27,490 | $6,410 | $21,080 |
| 2020 | $2,352 | $26,020 | $6,010 | $20,010 |
| 2019 | $2,360 | $26,020 | $6,010 | $20,010 |
| 2018 | $1,792 | $21,160 | $5,260 | $15,900 |
| 2017 | $1,821 | $21,160 | $5,260 | $15,900 |
| 2016 | $1,655 | $18,830 | $3,520 | $15,310 |
| 2015 | $846 | $18,830 | $3,520 | $15,310 |
| 2014 | $761 | $15,860 | $3,980 | $11,880 |
Source: Public Records
Map
Nearby Homes
- 13542 Achilles Dr
- 13483 Achilles Dr
- 181 Dianna Dr
- 108 Olympus Cir
- 130 Dianna Dr
- 13134 Deneb Dr
- 802 Altair Dr
- 13117 Deneb Dr
- 7920 E Phillips Cir
- 789 Hamal Dr
- 8170 S Tamarac St
- 8159 Lodgepole Trail
- 8860 Kachina Way
- 7057 Chestnut Hill St
- 8822 Fiesta Terrace
- 7041 Chestnut Hill Trail
- 9308 Miles Dr Unit 5
- 8966 E Otero Place
- 6887 Chestnut Hill St
- 8059 S Quince Cir
- 316 Aquarius Ct
- 438 Neptune Ct
- 434 Neptune Ct
- 444 Neptune Ct
- 306 Aquarius Ct
- 386 Aquarius Ct
- 396 Aquarius Ct
- 346 Aquarius Ct
- 424 Neptune Ct
- 448 Neptune Ct
- 376 Aquarius Ct
- 356 Helena Cir
- 374 Neptune Ct
- 366 Aquarius Ct
- 360 Helena Cir
- 414 Neptune Ct
- 384 Neptune Ct
- 382 Diane Ct
- 364 Neptune Ct
- 335 Helena Cir