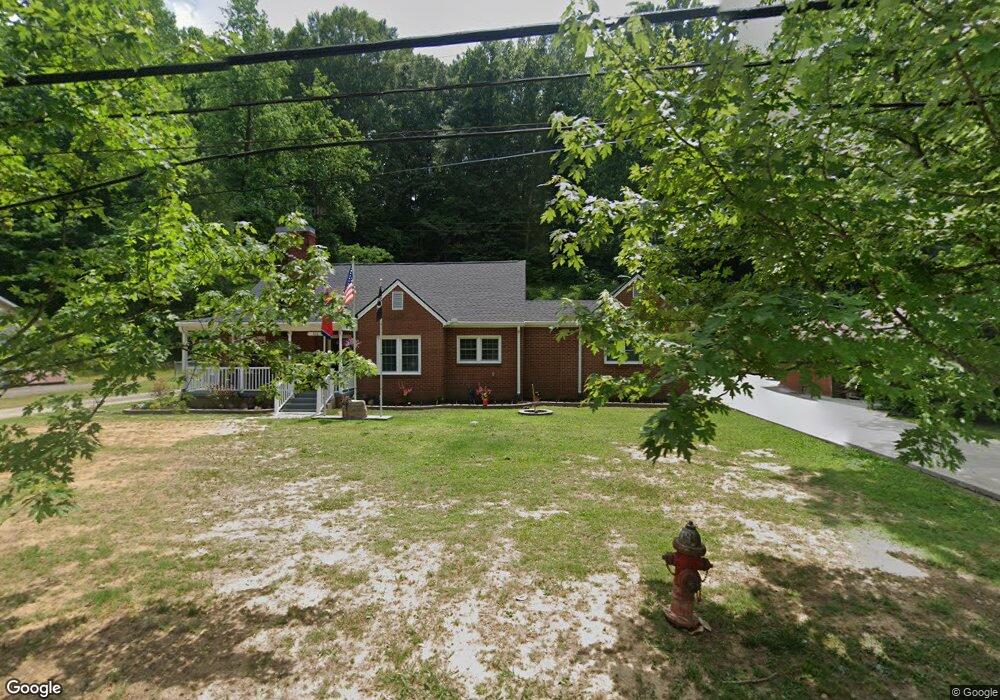
326 E Main St Waverly, TN 37185
Estimated Value: $198,575 - $285,000
Studio
2
Baths
1,360
Sq Ft
$183/Sq Ft
Est. Value
About This Home
This home is located at 326 E Main St, Waverly, TN 37185 and is currently estimated at $249,394, approximately $183 per square foot. 326 E Main St is a home located in Humphreys County.
Ownership History
Date
Name
Owned For
Owner Type
Purchase Details
Closed on
Feb 24, 2020
Sold by
Mroczkowski Shirley M
Bought by
Mroczkowski Joseph and Mroczkowski Shirley M
Current Estimated Value
Home Financials for this Owner
Home Financials are based on the most recent Mortgage that was taken out on this home.
Original Mortgage
$141,500
Outstanding Balance
$125,288
Interest Rate
3.6%
Mortgage Type
VA
Estimated Equity
$124,106
Purchase Details
Closed on
Oct 21, 2008
Sold by
Mcdonald Michael E
Bought by
Mroczkowski Joseph
Purchase Details
Closed on
Jul 18, 1997
Bought by
Mcdonald Michael E and Sally Diane
Purchase Details
Closed on
Jan 6, 1997
Bought by
Mcdonald Michael E and Sally Diane
Purchase Details
Closed on
Mar 11, 1946
Bought by
Stitt Curte C
Create a Home Valuation Report for This Property
The Home Valuation Report is an in-depth analysis detailing your home's value as well as a comparison with similar homes in the area
Home Values in the Area
Average Home Value in this Area
Purchase History
| Date | Buyer | Sale Price | Title Company |
|---|---|---|---|
| Mroczkowski Joseph | -- | Commonwealth Usa Setmnts Llc | |
| Mroczkowski Joseph | $107,000 | -- | |
| Mcdonald Michael E | -- | -- | |
| Mcdonald Michael E | $77,000 | -- | |
| Stitt Curte C | -- | -- |
Source: Public Records
Mortgage History
| Date | Status | Borrower | Loan Amount |
|---|---|---|---|
| Open | Mroczkowski Joseph | $141,500 |
Source: Public Records
Tax History
| Year | Tax Paid | Tax Assessment Tax Assessment Total Assessment is a certain percentage of the fair market value that is determined by local assessors to be the total taxable value of land and additions on the property. | Land | Improvement |
|---|---|---|---|---|
| 2025 | $1,444 | $47,525 | $5,200 | $42,325 |
| 2024 | $1,449 | $47,525 | $5,200 | $42,325 |
| 2023 | $1,448 | $47,525 | $5,200 | $42,325 |
| 2022 | $1,079 | $33,625 | $5,250 | $28,375 |
| 2021 | $852 | $12,400 | $5,250 | $7,150 |
| 2020 | $1,107 | $34,475 | $5,250 | $29,225 |
| 2019 | $942 | $28,600 | $5,200 | $23,400 |
| 2018 | $942 | $28,600 | $5,200 | $23,400 |
| 2017 | $942 | $28,600 | $5,200 | $23,400 |
| 2016 | $892 | $25,075 | $5,200 | $19,875 |
| 2015 | $892 | $25,075 | $5,200 | $19,875 |
| 2014 | $892 | $25,068 | $0 | $0 |
Source: Public Records
Map
Nearby Homes
- 317 E Main St
- 311 E Main St
- 206 Joe St
- 101 Simpson Ave
- 120 Joe St
- 424 E Commerce St
- 102 N Cooley Ave
- 104 Fairground Dr
- 116 Fairground Dr
- 209 Armstrong St
- 0 Old Skyline Dr Unit RTC3015061
- 202 Pine Hill Dr
- 128 Washington Cir
- 0 Bear Hollow Dr Unit 120
- 0 Bear Hollow Dr Unit RTC2747935
- 105 Hillwood Dr
- 207 Sycamore Ave
- 202 E Richland Ave
- 375 Highway 13 N
- 0 Matthews Hollow Rd
Your Personal Tour Guide
Ask me questions while you tour the home.