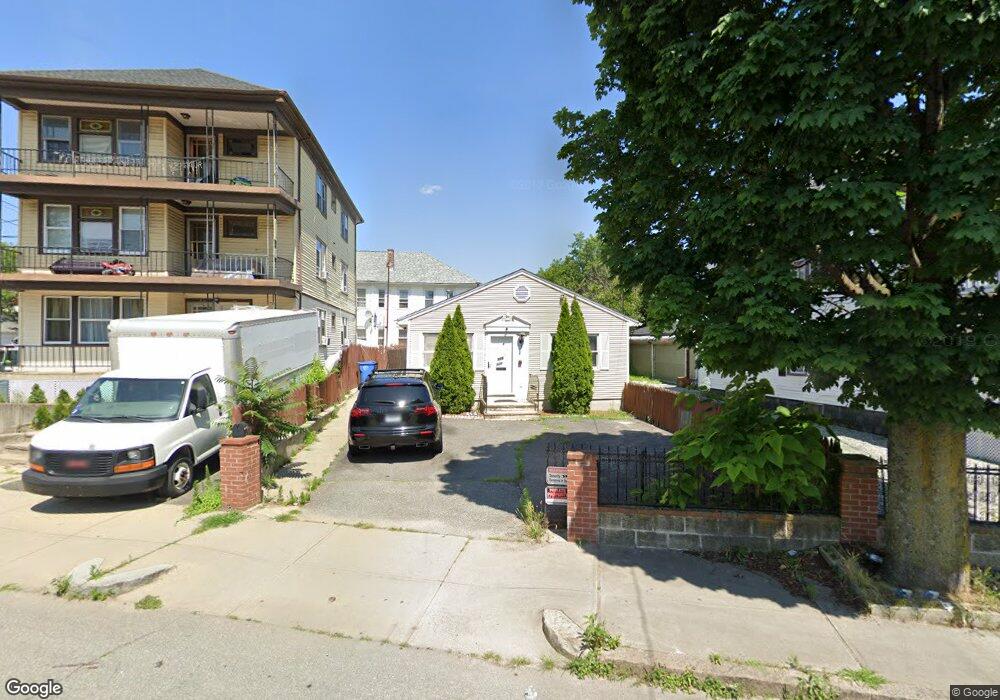
326 Webster Ave Cranston, RI 02920
Arlington NeighborhoodEstimated Value: $286,000 - $353,052
2
Beds
1
Bath
912
Sq Ft
$363/Sq Ft
Est. Value
About This Home
This home is located at 326 Webster Ave, Cranston, RI 02920 and is currently estimated at $330,763, approximately $362 per square foot. 326 Webster Ave is a home located in Providence County with nearby schools including Hugh B. Bain Middle School, Cranston High School East, and Achievement First Iluminar Mayoral Academy.
Ownership History
Date
Name
Owned For
Owner Type
Purchase Details
Closed on
Dec 20, 2018
Sold by
Santos Carlos A
Bought by
Santos Investments Llc
Current Estimated Value
Home Financials for this Owner
Home Financials are based on the most recent Mortgage that was taken out on this home.
Original Mortgage
$516,750
Outstanding Balance
$456,176
Interest Rate
4.9%
Mortgage Type
Undefined Multiple Amounts
Estimated Equity
-$125,413
Purchase Details
Closed on
Mar 18, 2010
Sold by
Jc Invest Llc
Bought by
Santos Carlos A
Purchase Details
Closed on
Oct 23, 2009
Sold by
Deutsche Bk
Bought by
Lim Jimme
Purchase Details
Closed on
Jul 29, 2009
Sold by
Guerrero Carlos E
Bought by
Deutsche Bk
Purchase Details
Closed on
Jan 31, 2007
Sold by
Cabral Adalgisa
Bought by
Guerrero Carlos E
Purchase Details
Closed on
Aug 6, 2004
Sold by
Louis Difrenna T
Bought by
Cabral Adalgisa
Purchase Details
Closed on
Oct 29, 1993
Sold by
Alstate Builders Inc
Bought by
Difrenna Louis R
Create a Home Valuation Report for This Property
The Home Valuation Report is an in-depth analysis detailing your home's value as well as a comparison with similar homes in the area
Home Values in the Area
Average Home Value in this Area
Purchase History
| Date | Buyer | Sale Price | Title Company |
|---|---|---|---|
| Santos Investments Llc | -- | -- | |
| Santos Carlos A | $80,000 | -- | |
| Lim Jimme | $64,000 | -- | |
| Deutsche Bk | $99,500 | -- | |
| Guerrero Carlos E | $202,000 | -- | |
| Cabral Adalgisa | $145,000 | -- | |
| Difrenna Louis R | $100,000 | -- |
Source: Public Records
Mortgage History
| Date | Status | Borrower | Loan Amount |
|---|---|---|---|
| Open | Difrenna Louis R | $516,750 | |
| Previous Owner | Difrenna Louis R | $76,684 |
Source: Public Records
Tax History Compared to Growth
Tax History
| Year | Tax Paid | Tax Assessment Tax Assessment Total Assessment is a certain percentage of the fair market value that is determined by local assessors to be the total taxable value of land and additions on the property. | Land | Improvement |
|---|---|---|---|---|
| 2025 | $3,885 | $279,900 | $103,500 | $176,400 |
| 2024 | $3,809 | $279,900 | $103,500 | $176,400 |
| 2023 | $3,304 | $174,800 | $45,400 | $129,400 |
| 2022 | $3,236 | $174,800 | $45,400 | $129,400 |
| 2021 | $3,146 | $174,800 | $45,400 | $129,400 |
| 2020 | $2,773 | $133,500 | $35,700 | $97,800 |
| 2019 | $2,773 | $133,500 | $35,700 | $97,800 |
| 2018 | $2,709 | $133,500 | $35,700 | $97,800 |
| 2017 | $2,379 | $103,700 | $16,200 | $87,500 |
| 2016 | $2,328 | $103,700 | $16,200 | $87,500 |
| 2015 | $2,328 | $103,700 | $16,200 | $87,500 |
| 2014 | $2,268 | $99,300 | $16,200 | $83,100 |
Source: Public Records
Map
Nearby Homes
- 330 Webster Ave
- 322 Webster Ave Unit 324
- 334 Webster Ave
- 458 Farmington Ave
- 64 Bailey St Unit 66
- 462 Farmington Ave
- 325 Webster Ave
- 312 Webster Ave Unit 314
- 58 Bailey St
- 329 Webster Ave
- 88 Bailey St
- 317 Webster Ave
- 54 Bailey St
- 308 Webster Ave Unit 310
- 457 Farmington Ave
- 69 Bailey St
- 472 Farmington Ave
- 313 Webster Ave
- 346 Webster Ave
- 90 Bailey St