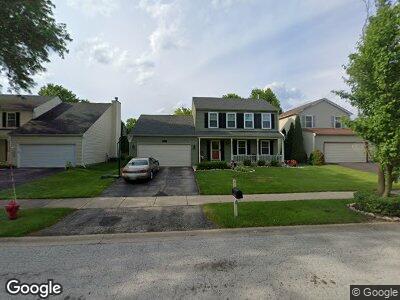
3270 Andover Dr Unit 19F Aurora, IL 60504
South East Village NeighborhoodEstimated Value: $362,000 - $399,000
3
Beds
3
Baths
1,696
Sq Ft
$222/Sq Ft
Est. Value
About This Home
This home is located at 3270 Andover Dr Unit 19F, Aurora, IL 60504 and is currently estimated at $376,656, approximately $222 per square foot. 3270 Andover Dr Unit 19F is a home located in DuPage County with nearby schools including Gombert Elementary School, Fischer Middle School, and Waubonsie Valley High School.
Ownership History
Date
Name
Owned For
Owner Type
Purchase Details
Closed on
May 2, 2000
Sold by
Minor James L and Minor Jaclyn R
Bought by
Brunson David A and Brunson Krystal M
Current Estimated Value
Home Financials for this Owner
Home Financials are based on the most recent Mortgage that was taken out on this home.
Original Mortgage
$148,630
Interest Rate
11.7%
Purchase Details
Closed on
Feb 4, 1998
Sold by
Mccann John C and Mccann Debra E
Bought by
Minor James L and Minor Jaclyn R
Home Financials for this Owner
Home Financials are based on the most recent Mortgage that was taken out on this home.
Original Mortgage
$119,600
Interest Rate
6.99%
Purchase Details
Closed on
Aug 24, 1995
Sold by
Reinle Michael A and Reinle Sharon L
Bought by
Mccann John C and Mccann Debra E
Home Financials for this Owner
Home Financials are based on the most recent Mortgage that was taken out on this home.
Original Mortgage
$146,200
Interest Rate
8%
Mortgage Type
FHA
Create a Home Valuation Report for This Property
The Home Valuation Report is an in-depth analysis detailing your home's value as well as a comparison with similar homes in the area
Home Values in the Area
Average Home Value in this Area
Purchase History
| Date | Buyer | Sale Price | Title Company |
|---|---|---|---|
| Brunson David A | $147,000 | -- | |
| Minor James L | $133,000 | -- | |
| Mccann John C | $153,000 | Collar Counties Title Plant |
Source: Public Records
Mortgage History
| Date | Status | Borrower | Loan Amount |
|---|---|---|---|
| Closed | Brunson David A | $120,000 | |
| Open | Brunson David A | $203,600 | |
| Closed | Brunson David A | $47,000 | |
| Closed | Brunson David A | $17,000 | |
| Closed | Brunson David A | $199,199 | |
| Closed | Brunson David Anthony | $27,800 | |
| Closed | Brunson David A | $11,600 | |
| Closed | Brunson David A | $148,630 | |
| Previous Owner | Minor James L | $119,600 | |
| Previous Owner | Mccann John C | $146,200 |
Source: Public Records
Tax History Compared to Growth
Tax History
| Year | Tax Paid | Tax Assessment Tax Assessment Total Assessment is a certain percentage of the fair market value that is determined by local assessors to be the total taxable value of land and additions on the property. | Land | Improvement |
|---|---|---|---|---|
| 2023 | $7,128 | $95,710 | $22,280 | $73,430 |
| 2022 | $6,644 | $85,230 | $19,670 | $65,560 |
| 2021 | $6,463 | $82,190 | $18,970 | $63,220 |
| 2020 | $6,542 | $82,190 | $18,970 | $63,220 |
| 2019 | $6,305 | $78,170 | $18,040 | $60,130 |
| 2018 | $5,577 | $69,140 | $15,830 | $53,310 |
| 2017 | $5,477 | $66,790 | $15,290 | $51,500 |
| 2016 | $5,371 | $64,090 | $14,670 | $49,420 |
| 2015 | $5,306 | $60,850 | $13,930 | $46,920 |
| 2014 | $5,906 | $65,280 | $14,820 | $50,460 |
| 2013 | $5,846 | $65,730 | $14,920 | $50,810 |
Source: Public Records
Map
Nearby Homes
- 1631 Tara Belle Pkwy
- 1660 Normantown Rd Unit 438
- 1704 Middlebury Dr Unit 302
- 3025 Diane Dr
- 1323 Middlebury Dr
- 3147 Cambria Ct Unit 474
- 3130 Winchester Ct E Unit 17B
- 1420 Bar Harbour Rd
- 3125 Winchester Ct E
- 3570 Jeremy Ranch Ct
- 10S154 Schoger Dr
- 1530 White Eagle Dr
- 3642 Monarch Cir
- 2675 Dorothy Dr
- 2690 Moss Ln
- 1040 Dover Ln Unit 17B
- 2125 Union Mill Dr Unit 1
- 2645 Lindrick Ln
- 2630 Lindrick Ln
- 3401 Charlemaine Dr
- 3270 Andover Dr Unit 19F
- 3290 Andover Dr
- 3250 Andover Dr Unit 19F
- 3174 Boothbay Ln
- 3230 Andover Dr
- 3178 Boothbay Ln Unit 9E
- 3251 Andover Dr
- 3271 Andover Dr
- 3210 Andover Dr
- 3291 Andover Dr Unit 19F
- 3231 Andover Dr Unit 19F
- 3166 Boothbay Ln
- 1513 Andover Dr
- 3211 Andover Dr
- 3200 Andover Dr
- 1511 Andover Dr
- 3270 Johnsbury Ct
- 3290 Johnsbury Ct
- 3162 Boothbay Ln
- 3145 Boothbay Ln