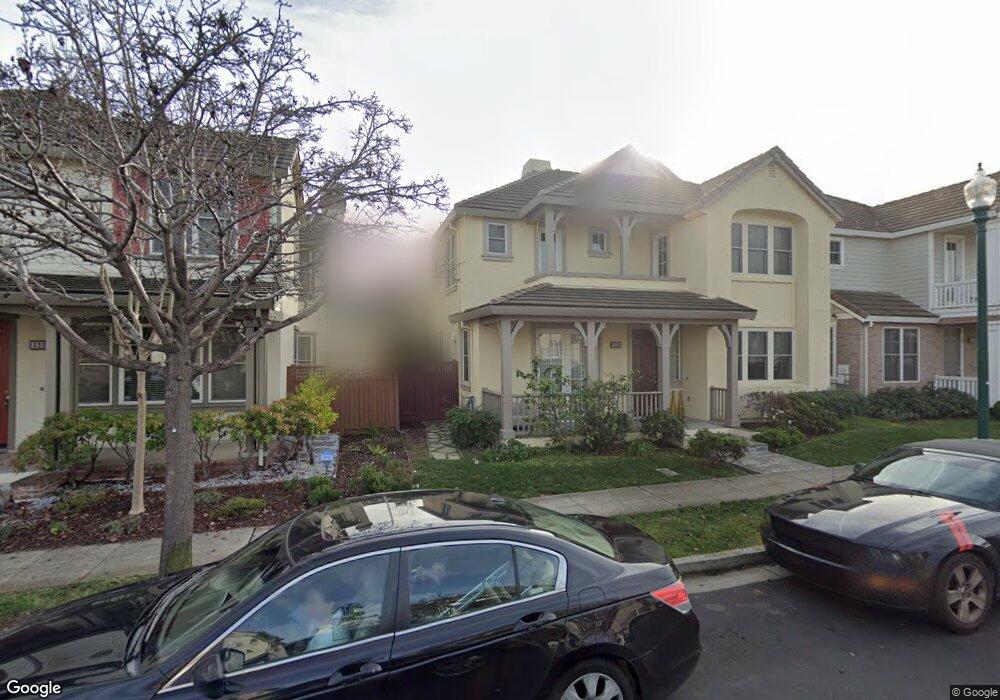
328 Ansel Ave Alameda, CA 94501
West Alameda NeighborhoodEstimated Value: $1,402,051 - $1,505,000
3
Beds
3
Baths
2,219
Sq Ft
$657/Sq Ft
Est. Value
About This Home
This home is located at 328 Ansel Ave, Alameda, CA 94501 and is currently estimated at $1,457,763, approximately $656 per square foot. 328 Ansel Ave is a home located in Alameda County with nearby schools including Ruby Bridges Elementary School, Encinal Junior/Senior High, and The Academy of Alameda TK-8 School.
Ownership History
Date
Name
Owned For
Owner Type
Purchase Details
Closed on
Mar 14, 2021
Sold by
Kan Farand C
Bought by
Kan Farand C and Kan Grace Lin
Current Estimated Value
Home Financials for this Owner
Home Financials are based on the most recent Mortgage that was taken out on this home.
Original Mortgage
$548,000
Outstanding Balance
$406,428
Interest Rate
2.73%
Mortgage Type
New Conventional
Estimated Equity
$1,051,335
Purchase Details
Closed on
Nov 23, 2012
Sold by
Kan Han Pin and Kan Della C
Bought by
Kan Farand C
Purchase Details
Closed on
Oct 12, 2006
Sold by
Bayport Alameda Associates Llc
Bought by
Kan Han Pin and Kan Della C
Home Financials for this Owner
Home Financials are based on the most recent Mortgage that was taken out on this home.
Original Mortgage
$417,000
Interest Rate
6.22%
Mortgage Type
Purchase Money Mortgage
Create a Home Valuation Report for This Property
The Home Valuation Report is an in-depth analysis detailing your home's value as well as a comparison with similar homes in the area
Home Values in the Area
Average Home Value in this Area
Purchase History
| Date | Buyer | Sale Price | Title Company |
|---|---|---|---|
| Kan Farand C | -- | Old Republic Title Company | |
| Kan Farand C | -- | None Available | |
| Kan Han Pin | $881,500 | First American Title Co |
Source: Public Records
Mortgage History
| Date | Status | Borrower | Loan Amount |
|---|---|---|---|
| Open | Kan Farand C | $548,000 | |
| Previous Owner | Kan Han Pin | $417,000 |
Source: Public Records
Tax History Compared to Growth
Tax History
| Year | Tax Paid | Tax Assessment Tax Assessment Total Assessment is a certain percentage of the fair market value that is determined by local assessors to be the total taxable value of land and additions on the property. | Land | Improvement |
|---|---|---|---|---|
| 2025 | $12,936 | $793,396 | $240,119 | $560,277 |
| 2024 | $12,936 | $777,705 | $235,411 | $549,294 |
| 2023 | $12,495 | $769,320 | $230,796 | $538,524 |
| 2022 | $12,851 | $747,240 | $226,272 | $527,968 |
| 2021 | $12,583 | $732,452 | $221,835 | $517,617 |
| 2020 | $12,206 | $731,873 | $219,562 | $512,311 |
| 2019 | $11,503 | $717,527 | $215,258 | $502,269 |
| 2018 | $11,214 | $703,461 | $211,038 | $492,423 |
| 2017 | $10,727 | $689,668 | $206,900 | $482,768 |
| 2016 | $10,703 | $676,148 | $202,844 | $473,304 |
| 2015 | $10,638 | $665,995 | $199,798 | $466,197 |
| 2014 | $10,179 | $693,131 | $207,939 | $485,192 |
Source: Public Records
Map
Nearby Homes
- 250 Jack London Ave
- 2683 5th St
- 2048 Starling Ln
- 2729 5th St
- 142 Coronado Ave
- 2768 Bette St
- 310 Spruce St
- 108 Cypress St Unit D
- 2816 Cathwood Ln
- 1710 2nd St
- 2853 Cathwood Ln
- 2866 Crusader St
- 467 Mitchell Ave
- 477 Mitchell Ave
- 538 Martin Mariner Ave
- 405 Sentinel Dr
- 2818 5th St
- 343 Lincoln Ave
- 8 Sanderling Ct
- 537 Pacific Ave