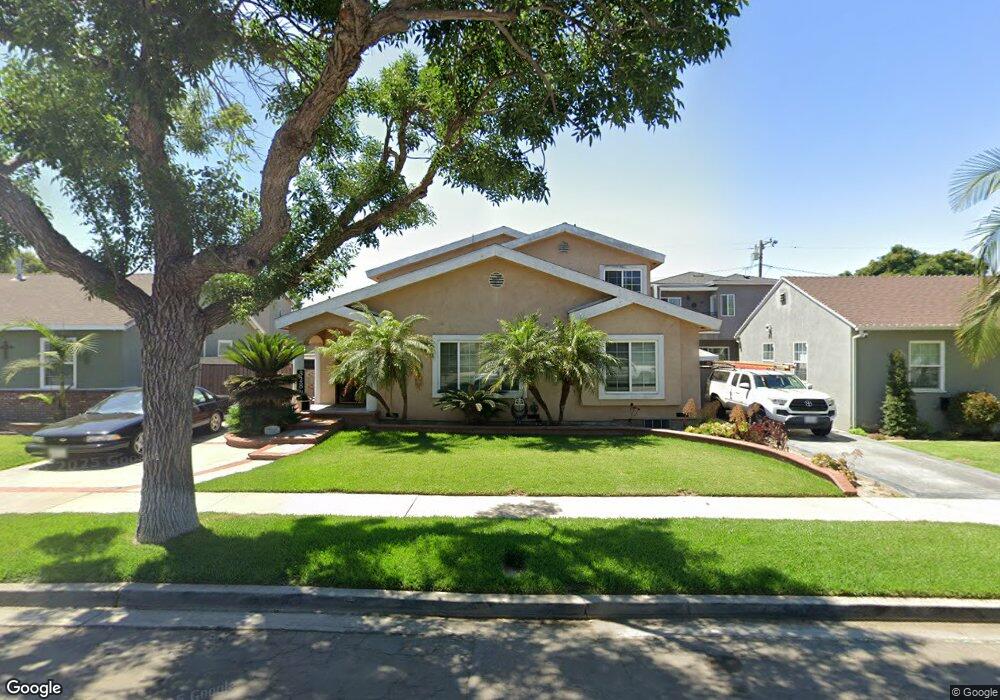
328 E Smith St Long Beach, CA 90805
DeForest Park NeighborhoodEstimated Value: $651,000 - $962,875
4
Beds
3
Baths
2,534
Sq Ft
$324/Sq Ft
Est. Value
About This Home
This home is located at 328 E Smith St, Long Beach, CA 90805 and is currently estimated at $821,219, approximately $324 per square foot. 328 E Smith St is a home located in Los Angeles County with nearby schools including Colin Powell Academy for Success, Jordan High School, and Gethsemane Baptist Christian School.
Ownership History
Date
Name
Owned For
Owner Type
Purchase Details
Closed on
Jul 21, 2017
Sold by
Phillips Dennis
Bought by
Phillips Dennis and Phillips Kamren
Current Estimated Value
Purchase Details
Closed on
Aug 23, 1999
Sold by
Yin Jae Shik and Yin Moon Hee
Bought by
Phillips Dennis
Home Financials for this Owner
Home Financials are based on the most recent Mortgage that was taken out on this home.
Original Mortgage
$175,553
Interest Rate
7.95%
Mortgage Type
FHA
Purchase Details
Closed on
Jul 2, 1998
Sold by
Va
Bought by
Yin Jae Shik and Yin Moon Hee
Home Financials for this Owner
Home Financials are based on the most recent Mortgage that was taken out on this home.
Original Mortgage
$126,500
Interest Rate
7.03%
Mortgage Type
Seller Take Back
Purchase Details
Closed on
Jun 11, 1997
Sold by
Countrywide Funding Corp
Bought by
Va
Purchase Details
Closed on
May 30, 1997
Sold by
Yi Javier P and Countrywide Home Loans Inc
Bought by
Countrywide Home Loans Inc and Countrywide Funding Corp
Create a Home Valuation Report for This Property
The Home Valuation Report is an in-depth analysis detailing your home's value as well as a comparison with similar homes in the area
Home Values in the Area
Average Home Value in this Area
Purchase History
| Date | Buyer | Sale Price | Title Company |
|---|---|---|---|
| Phillips Dennis | -- | None Available | |
| Phillips Dennis | $177,000 | American Title Co | |
| Yin Jae Shik | $126,500 | First American Title Co | |
| Va | -- | Fidelity National Title Ins | |
| Countrywide Home Loans Inc | $110,668 | Fidelity National Title Ins |
Source: Public Records
Mortgage History
| Date | Status | Borrower | Loan Amount |
|---|---|---|---|
| Previous Owner | Phillips Dennis | $175,553 | |
| Previous Owner | Yin Jae Shik | $126,500 |
Source: Public Records
Tax History
| Year | Tax Paid | Tax Assessment Tax Assessment Total Assessment is a certain percentage of the fair market value that is determined by local assessors to be the total taxable value of land and additions on the property. | Land | Improvement |
|---|---|---|---|---|
| 2025 | $5,625 | $416,785 | $138,467 | $278,318 |
| 2024 | $5,625 | $408,613 | $135,752 | $272,861 |
| 2023 | $5,533 | $400,602 | $133,091 | $267,511 |
| 2022 | $5,207 | $392,748 | $130,482 | $262,266 |
| 2021 | $5,095 | $385,048 | $127,924 | $257,124 |
| 2019 | $5,024 | $373,630 | $124,131 | $249,499 |
| 2018 | $4,783 | $366,305 | $121,698 | $244,607 |
| 2016 | $4,388 | $352,082 | $116,973 | $235,109 |
| 2015 | $4,216 | $346,794 | $115,216 | $231,578 |
| 2014 | $4,190 | $340,002 | $112,960 | $227,042 |
Source: Public Records
Map
Nearby Homes
- 6067 Jaymills Ave
- 447 E Adair St
- 410 E 60th St
- 6165 Linden Ave
- 461 E Osgood St
- 246 E Hullett St
- 6064 Atlantic Ave
- 6475 Atlantic Ave Unit 911
- 6475 Atlantic Ave Unit 815
- 200 E Barclay St
- 260 E South St
- 475 E Hullett St
- 5876 Linden Ave Unit 7
- 5876 Linden Ave Unit 8
- 5868 Linden Ave Unit 6
- 5868 Linden Ave Unit 3
- 5860 Linden Ave Unit 8
- 6034 Lime Ave
- 6014 Lime Ave
- 155 E Barclay St
Your Personal Tour Guide
Ask me questions while you tour the home.