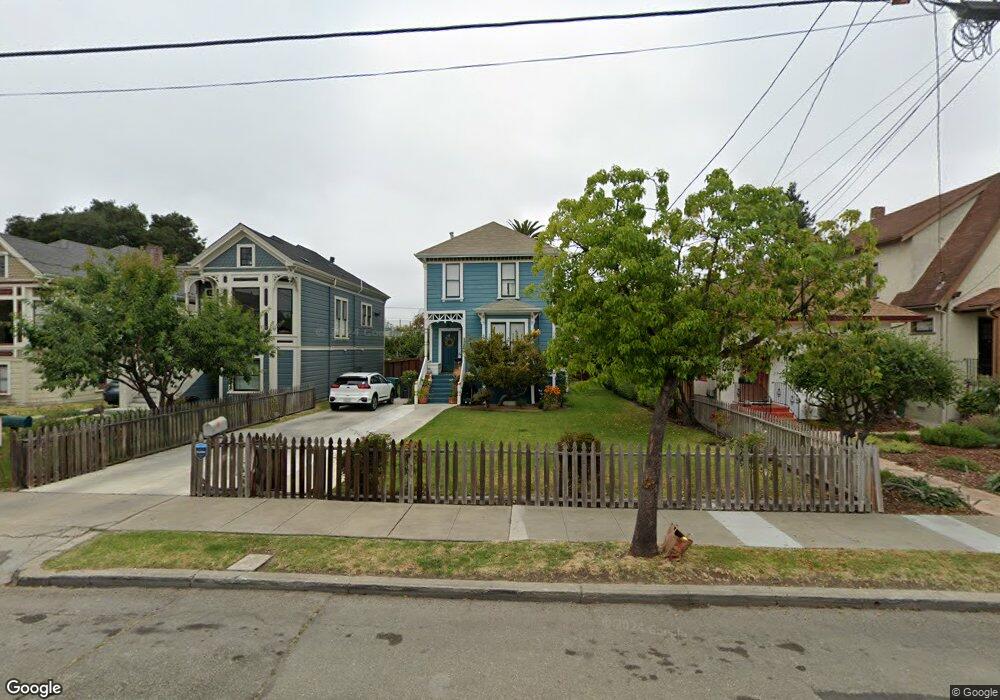
3285 Briggs Ave Alameda, CA 94501
Downtown Alameda NeighborhoodEstimated Value: $1,943,000 - $2,402,000
4
Beds
3
Baths
2,574
Sq Ft
$852/Sq Ft
Est. Value
About This Home
This home is located at 3285 Briggs Ave, Alameda, CA 94501 and is currently estimated at $2,192,064, approximately $851 per square foot. 3285 Briggs Ave is a home located in Alameda County with nearby schools including Frank Otis Elementary School, Lincoln Middle School, and Alameda High School.
Ownership History
Date
Name
Owned For
Owner Type
Purchase Details
Closed on
Mar 6, 2019
Sold by
Tessarowicz Alec and Lau Heung Cindy Met
Bought by
The Tessarowicz Family Living Trust
Current Estimated Value
Purchase Details
Closed on
Jun 2, 2017
Sold by
Burkholder Jeff and Burkholder Estelle
Bought by
Tessarowicz Alec and Lau Cindy
Purchase Details
Closed on
Jun 9, 2015
Sold by
Ohlson Nils P and Sundheim Miriam L
Bought by
Burkholder Jeff and Burkholder Estelle
Purchase Details
Closed on
Dec 23, 2008
Sold by
Ohlson John Algoth and Johnalgoth Ohlson Revocable Tr
Bought by
Ohlson Nils P
Purchase Details
Closed on
Jul 29, 2008
Sold by
Ohlson John Algoth
Bought by
Ohlson John Algoth and Ohlson John Algoth
Purchase Details
Closed on
Sep 15, 2004
Sold by
Ohlson Nils P and Sundheim Miriam L
Bought by
Ohlson Nils P and Sundheim Miriam L
Purchase Details
Closed on
Mar 20, 1996
Sold by
Ohlson John A and Ohlson Grace K
Bought by
Ohlson John A and Ohlson Grace K
Create a Home Valuation Report for This Property
The Home Valuation Report is an in-depth analysis detailing your home's value as well as a comparison with similar homes in the area
Home Values in the Area
Average Home Value in this Area
Purchase History
| Date | Buyer | Sale Price | Title Company |
|---|---|---|---|
| The Tessarowicz Family Living Trust | -- | None Available | |
| Tessarowicz Alec | $1,778,000 | Fidelity National Title Co | |
| Burkholder Jeff | $919,000 | Fidelity National Title Co | |
| Ohlson Nils P | -- | None Available | |
| Ohlson John Algoth | -- | None Available | |
| Ohlson Nils P | -- | -- | |
| Ohlson Nils P | -- | -- | |
| Ohlson John A | -- | -- |
Source: Public Records
Tax History Compared to Growth
Tax History
| Year | Tax Paid | Tax Assessment Tax Assessment Total Assessment is a certain percentage of the fair market value that is determined by local assessors to be the total taxable value of land and additions on the property. | Land | Improvement |
|---|---|---|---|---|
| 2025 | $27,464 | $2,061,539 | $618,938 | $1,449,601 |
| 2024 | $27,464 | $2,020,990 | $606,805 | $1,421,185 |
| 2023 | $26,334 | $1,988,226 | $594,907 | $1,393,319 |
| 2022 | $25,705 | $1,942,245 | $583,243 | $1,366,002 |
| 2021 | $24,976 | $1,899,031 | $571,809 | $1,334,222 |
| 2020 | $24,658 | $1,886,494 | $565,948 | $1,320,546 |
| 2019 | $23,838 | $1,849,518 | $554,855 | $1,294,663 |
| 2018 | $23,203 | $1,813,253 | $543,976 | $1,269,277 |
| 2017 | $13,002 | $992,269 | $465,997 | $526,272 |
| 2016 | $12,563 | $933,014 | $456,862 | $476,152 |
| 2015 | $3,603 | $167,140 | $33,139 | $134,001 |
| 2014 | $3,261 | $163,866 | $32,490 | $131,376 |
Source: Public Records
Map
Nearby Homes
- 1259 Eastshore Dr
- 3246 Garfield Ave
- 3103 Central Ave
- 3208 Washington St
- 3114 Thompson Ave
- 3029 Thompson Ave
- 2839 Washington St
- 1238 Versailles Ave
- 3171 Bayview Dr
- 2829 Otis Dr
- 2620 Encinal Ave
- 2022 High St Unit A
- 3012 Bayview Dr
- 1831 Harvard Dr
- 1210 Broadway Unit A
- 975 Pearl St
- 1542 Broadway
- 642 Centre Ct
- 641 Centre Ct
- 1601 Broadway Unit 9
- 3281 Briggs Ave
- 3287 Briggs Ave
- 3275 Briggs Ave
- 3293 Briggs Ave
- 1345 Fernside Blvd
- 1349 Fernside Blvd
- 3271 Briggs Ave
- 1343 Fernside Blvd
- 1351 Fernside Blvd
- 3280 Sterling Ave
- 3276 Sterling Ave
- 1337 Fernside Blvd
- 3286 Sterling Ave
- 3272 Sterling Ave
- 3292 Sterling Ave
- 3267 Briggs Ave
- 3265 Briggs Ave
- 3269 Briggs Ave
- 3278 Briggs Ave
- 3266 Sterling Ave