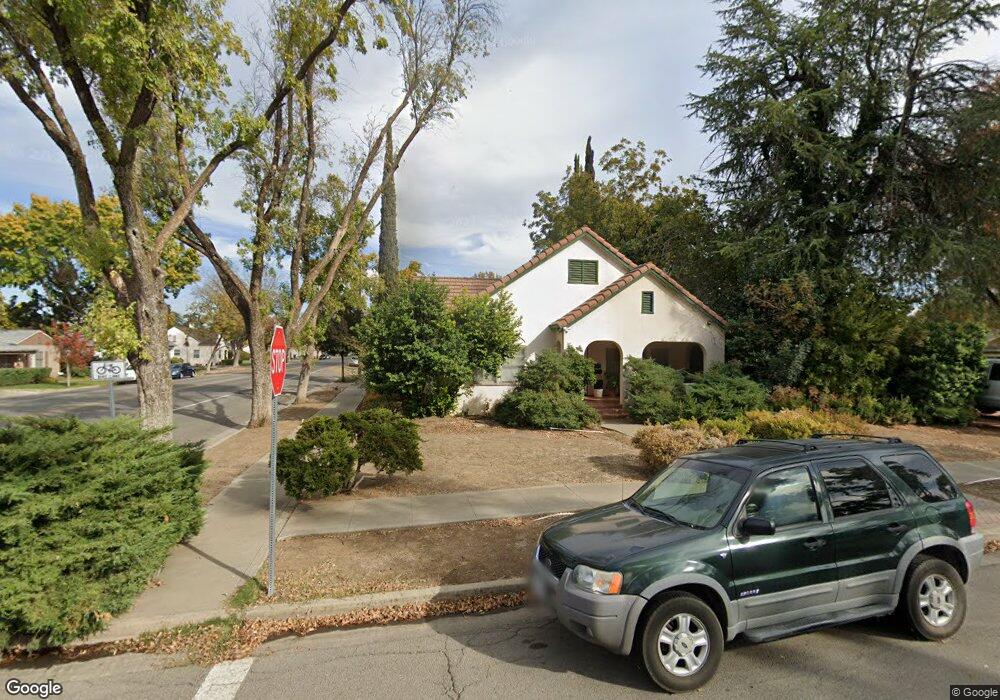
329 N 6th St Patterson, CA 95363
Estimated Value: $380,000 - $514,419
2
Beds
2
Baths
2,355
Sq Ft
$185/Sq Ft
Est. Value
About This Home
This home is located at 329 N 6th St, Patterson, CA 95363 and is currently estimated at $436,105, approximately $185 per square foot. 329 N 6th St is a home located in Stanislaus County with nearby schools including Northmead Elementary School, Creekside Middle School, and Patterson High School.
Ownership History
Date
Name
Owned For
Owner Type
Purchase Details
Closed on
Apr 7, 2004
Sold by
Farinha Domingos A and Farinha Domingas A
Bought by
Farinha Domingos A
Current Estimated Value
Home Financials for this Owner
Home Financials are based on the most recent Mortgage that was taken out on this home.
Original Mortgage
$92,000
Interest Rate
5.57%
Mortgage Type
New Conventional
Purchase Details
Closed on
Jun 28, 2002
Sold by
Farinha Domingas A and Farinha Jeanne L
Bought by
Farinha Domingas A
Home Financials for this Owner
Home Financials are based on the most recent Mortgage that was taken out on this home.
Original Mortgage
$80,000
Interest Rate
9.05%
Mortgage Type
Purchase Money Mortgage
Purchase Details
Closed on
Mar 16, 2000
Sold by
Farinha Domingos and Farinha Jeanne L
Bought by
Farinha Domingos A and Farinha Jeanne L
Create a Home Valuation Report for This Property
The Home Valuation Report is an in-depth analysis detailing your home's value as well as a comparison with similar homes in the area
Home Values in the Area
Average Home Value in this Area
Purchase History
| Date | Buyer | Sale Price | Title Company |
|---|---|---|---|
| Farinha Domingos A | -- | Alliance Title Company | |
| Farinha Domingas A | -- | Fidelity National Title Co | |
| Farinha Domingos A | -- | Fidelity National Title Co | |
| Farinha Domingos A | -- | -- |
Source: Public Records
Mortgage History
| Date | Status | Borrower | Loan Amount |
|---|---|---|---|
| Closed | Farinha Domingos A | $92,000 | |
| Closed | Farinha Domingos A | $80,000 |
Source: Public Records
Tax History
| Year | Tax Paid | Tax Assessment Tax Assessment Total Assessment is a certain percentage of the fair market value that is determined by local assessors to be the total taxable value of land and additions on the property. | Land | Improvement |
|---|---|---|---|---|
| 2025 | $1,342 | $114,048 | $15,478 | $98,570 |
| 2024 | $1,338 | $111,813 | $15,175 | $96,638 |
| 2023 | $1,308 | $109,622 | $14,878 | $94,744 |
| 2022 | $1,234 | $107,474 | $14,587 | $92,887 |
| 2021 | $1,217 | $105,367 | $14,301 | $91,066 |
| 2020 | $1,218 | $104,288 | $14,155 | $90,133 |
| 2019 | $1,199 | $102,244 | $13,878 | $88,366 |
| 2018 | $1,142 | $100,240 | $13,606 | $86,634 |
| 2017 | $1,113 | $98,276 | $13,340 | $84,936 |
| 2016 | $1,088 | $96,350 | $13,079 | $83,271 |
| 2015 | $1,072 | $94,904 | $12,883 | $82,021 |
| 2014 | $1,048 | $93,046 | $12,631 | $80,415 |
Source: Public Records
Map
Nearby Homes
- 445 M St
- 701 N 3rd St
- 312 Roxanne Dr
- 216 Barros St
- 408 Peregrine Dr
- 855 Toyon Ln
- 15707 S 9th St
- 932 Arambel Dr
- 140 Ivy Ave Unit A5
- 140 Ivy Ave Unit 39
- 250 E Las Palmas Ave Unit 47
- 250 E Las Palmas Ave Unit 13
- 708 Bonneau Ct
- 849 Miraggio Dr
- 517 Nordell Place
- 1314 Sutter Creek Ct
- 432 Meadow Creek Dr
- 1430 Walnut Ave
- 600 Sears Dr
- 0 Orange Ave
Your Personal Tour Guide
Ask me questions while you tour the home.