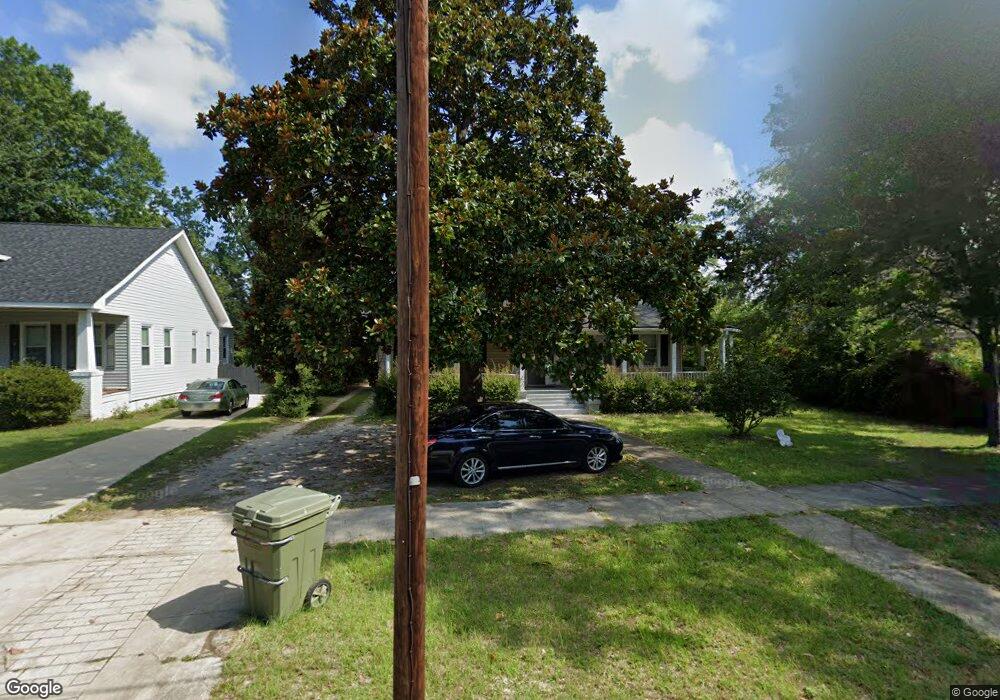
329 W Calhoun St Sumter, SC 29150
Hampton Park NeighborhoodEstimated Value: $161,000 - $228,000
3
Beds
2
Baths
2,589
Sq Ft
$71/Sq Ft
Est. Value
About This Home
This home is located at 329 W Calhoun St, Sumter, SC 29150 and is currently estimated at $183,270, approximately $70 per square foot. 329 W Calhoun St is a home located in Sumter County with nearby schools including Willow Drive Elementary School, Alice Drive Middle School, and Sumter High School.
Ownership History
Date
Name
Owned For
Owner Type
Purchase Details
Closed on
Jul 23, 2020
Sold by
Curtis Warren S
Bought by
West Kimberly
Current Estimated Value
Home Financials for this Owner
Home Financials are based on the most recent Mortgage that was taken out on this home.
Original Mortgage
$134,000
Outstanding Balance
$118,518
Interest Rate
3.2%
Mortgage Type
Land Contract Argmt. Of Sale
Estimated Equity
$64,752
Purchase Details
Closed on
Feb 23, 2011
Sold by
Secretary Of Veterans Affairs
Bought by
Curtis Charles H and Curtis Warren S
Purchase Details
Closed on
Feb 16, 2010
Sold by
Arkon Shawn E and Arkon Heidi S
Bought by
Secretary Of Veterans Affairs
Purchase Details
Closed on
Mar 29, 2007
Sold by
Estate Of Mary M R Chewning
Bought by
Arkon Shawn E and Arkon Heidi S
Home Financials for this Owner
Home Financials are based on the most recent Mortgage that was taken out on this home.
Original Mortgage
$131,773
Interest Rate
6.15%
Mortgage Type
VA
Create a Home Valuation Report for This Property
The Home Valuation Report is an in-depth analysis detailing your home's value as well as a comparison with similar homes in the area
Home Values in the Area
Average Home Value in this Area
Purchase History
| Date | Buyer | Sale Price | Title Company |
|---|---|---|---|
| West Kimberly | $135,000 | None Available | |
| West Kimberly | -- | Curtis & Croft Llc | |
| Curtis Charles H | $60,000 | -- | |
| Secretary Of Veterans Affairs | -- | -- | |
| Arkon Shawn E | $129,000 | None Available |
Source: Public Records
Mortgage History
| Date | Status | Borrower | Loan Amount |
|---|---|---|---|
| Open | West Kimberly | $134,000 | |
| Previous Owner | Arkon Shawn E | $131,773 |
Source: Public Records
Tax History Compared to Growth
Tax History
| Year | Tax Paid | Tax Assessment Tax Assessment Total Assessment is a certain percentage of the fair market value that is determined by local assessors to be the total taxable value of land and additions on the property. | Land | Improvement |
|---|---|---|---|---|
| 2025 | $1,856 | $3,230 | $1,110 | $2,120 |
| 2024 | $1,856 | $4,840 | $1,660 | $3,180 |
| 2023 | $1,856 | $4,850 | $1,670 | $3,180 |
| 2022 | $629 | $3,230 | $1,110 | $2,120 |
| 2021 | $1,877 | $3,230 | $1,110 | $2,120 |
| 2020 | $1,877 | $4,820 | $1,830 | $2,990 |
| 2019 | $1,868 | $4,820 | $1,830 | $2,990 |
| 2018 | $1,877 | $4,820 | $1,830 | $2,990 |
| 2017 | $1,888 | $4,820 | $1,830 | $2,990 |
| 2016 | $1,865 | $4,820 | $1,830 | $2,990 |
| 2015 | $1,902 | $5,010 | $1,830 | $3,180 |
| 2014 | $1,902 | $3,340 | $1,220 | $2,120 |
| 2013 | -- | $3,340 | $1,220 | $2,120 |
Source: Public Records
Map
Nearby Homes
- 122 N Salem Ave
- 202 N Salem Ave
- 401 W Hampton Ave
- 214 Haynsworth St
- 404 W Hampton Ave
- 118 Mcqueen St
- 112 Hasel St
- 315 N Salem Ave
- 219 Haynsworth St
- 321 W Hampton Ave
- 343 W Liberty St
- 116 Mood Ave
- 17 Folsom St
- 125 Church St
- 5 Glendale Ct
- 30 Church Ct
- 102 Wactor St
- 35 Wright St
- 407 W Bartlette St
- 123 N Guignard Dr
- 331 W Calhoun St
- 325 W Calhoun St
- Lot 25 W Calhoun St
- 116 W Calhoun St
- 512, 516 W Calhoun St
- 7 Marion Ave
- 333 W Calhoun St
- 321 E W Calhoun St
- 11 Marion Ave
- 321 W Calhoun St
- 321 W Calhoun St
- 321 W Calhoun St
- 321 W Calhoun St
- 321 W Calhoun St
- 321 W Calhoun St
- 326 W Calhoun St
- 321 W Calhoun St
- 330 W Calhoun St
- 15 Marion Ave
- 321 W Calhoun St