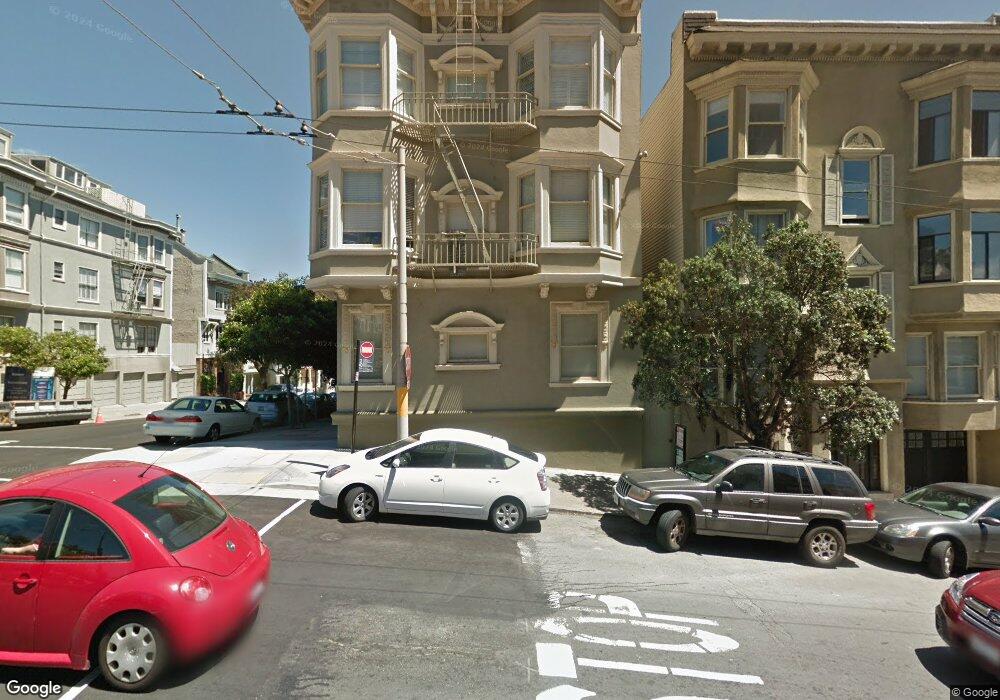
3295 Clay St Unit 1 San Francisco, CA 94115
Pacific Heights NeighborhoodEstimated Value: $1,172,656 - $1,430,000
2
Beds
1
Bath
1,105
Sq Ft
$1,194/Sq Ft
Est. Value
About This Home
This home is located at 3295 Clay St Unit 1, San Francisco, CA 94115 and is currently estimated at $1,319,414, approximately $1,194 per square foot. 3295 Clay St Unit 1 is a home located in San Francisco County with nearby schools including Sutro Elementary School, Roosevelt Middle School, and Presidio Hill School.
Ownership History
Date
Name
Owned For
Owner Type
Purchase Details
Closed on
Jun 1, 1999
Sold by
Kemp Barbara L
Bought by
Kemp Barbara Louise
Current Estimated Value
Purchase Details
Closed on
Nov 25, 1997
Sold by
Cooper David L and Cooper Sheri Mitchell
Bought by
Kemp Barbara L
Home Financials for this Owner
Home Financials are based on the most recent Mortgage that was taken out on this home.
Original Mortgage
$250,000
Outstanding Balance
$34,029
Interest Rate
4.95%
Estimated Equity
$1,285,385
Purchase Details
Closed on
Feb 21, 1996
Sold by
Michels Nancy Beckman and Beckman Nancy J
Bought by
Cooper David L
Home Financials for this Owner
Home Financials are based on the most recent Mortgage that was taken out on this home.
Original Mortgage
$207,000
Interest Rate
7.04%
Mortgage Type
Balloon
Purchase Details
Closed on
Jun 16, 1993
Sold by
Beckman Woody
Bought by
Beckman Nancy
Create a Home Valuation Report for This Property
The Home Valuation Report is an in-depth analysis detailing your home's value as well as a comparison with similar homes in the area
Home Values in the Area
Average Home Value in this Area
Purchase History
| Date | Buyer | Sale Price | Title Company |
|---|---|---|---|
| Kemp Barbara Louise | -- | -- | |
| Kemp Barbara L | $365,000 | Old Republic Title Company | |
| Cooper David L | $320,000 | Fidelity National Title Ins | |
| Michels Nancy Beckman | -- | Fidelity National Title Ins | |
| Beckman Nancy | -- | Old Republic Title Company |
Source: Public Records
Mortgage History
| Date | Status | Borrower | Loan Amount |
|---|---|---|---|
| Open | Kemp Barbara L | $250,000 | |
| Previous Owner | Cooper David L | $207,000 |
Source: Public Records
Tax History Compared to Growth
Tax History
| Year | Tax Paid | Tax Assessment Tax Assessment Total Assessment is a certain percentage of the fair market value that is determined by local assessors to be the total taxable value of land and additions on the property. | Land | Improvement |
|---|---|---|---|---|
| 2025 | $6,808 | $582,795 | $319,342 | $263,453 |
| 2024 | $6,808 | $571,369 | $313,081 | $258,288 |
| 2023 | $7,001 | $560,167 | $306,943 | $253,224 |
| 2022 | $6,833 | $549,184 | $300,925 | $248,259 |
| 2021 | $6,721 | $538,417 | $295,025 | $243,392 |
| 2020 | $6,740 | $532,897 | $292,000 | $240,897 |
| 2019 | $6,520 | $522,449 | $286,275 | $236,174 |
| 2018 | $6,041 | $512,206 | $280,662 | $231,544 |
| 2017 | $5,970 | $502,163 | $275,159 | $227,004 |
| 2016 | $5,856 | $492,317 | $269,764 | $222,553 |
| 2015 | $5,785 | $484,923 | $265,712 | $219,211 |
| 2014 | $5,634 | $475,425 | $260,508 | $214,917 |
Source: Public Records
Map
Nearby Homes
- 333 Presidio Ave Unit 5
- 1819 Lyon St Unit 3
- 1819 Lyon St Unit 1
- 3100 California St
- 3332 Washington St
- 3014 Pine St
- 3014 Pine St Unit A
- 440 Laurel St
- 3315 Jackson St
- 436a Laurel St
- 2978 Pine St
- 315 Laurel St
- 3124 Washington St
- 3515 Sacramento St
- 1910 Baker St
- 3062 Jackson St
- 3561 Sacramento St Unit A
- 3583 Sacramento St
- 2033 Broderick St
- 2025 Broderick St Unit 6
- 3295 Clay St Unit 6
- 3295 Clay St Unit 5
- 3295 Clay St Unit 4
- 3295 Clay St Unit 3
- 3295 Clay St Unit 2
- 322 Presidio Ave Unit 5
- 322 Presidio Ave Unit 4
- 322 Presidio Ave Unit 3
- 322 Presidio Ave Unit 2
- 322 Presidio Ave Unit 6
- 3259 Clay St
- 3294 Clay St Unit 5
- 3294 Clay St Unit 4
- 3294 Clay St Unit 3
- 3294 Clay St Unit 2
- 3294 Clay St Unit 1
- 326 Presidio Ave
- 3245 Clay St
- 3245 Clay St Unit B
- 3245 Clay St Unit 2