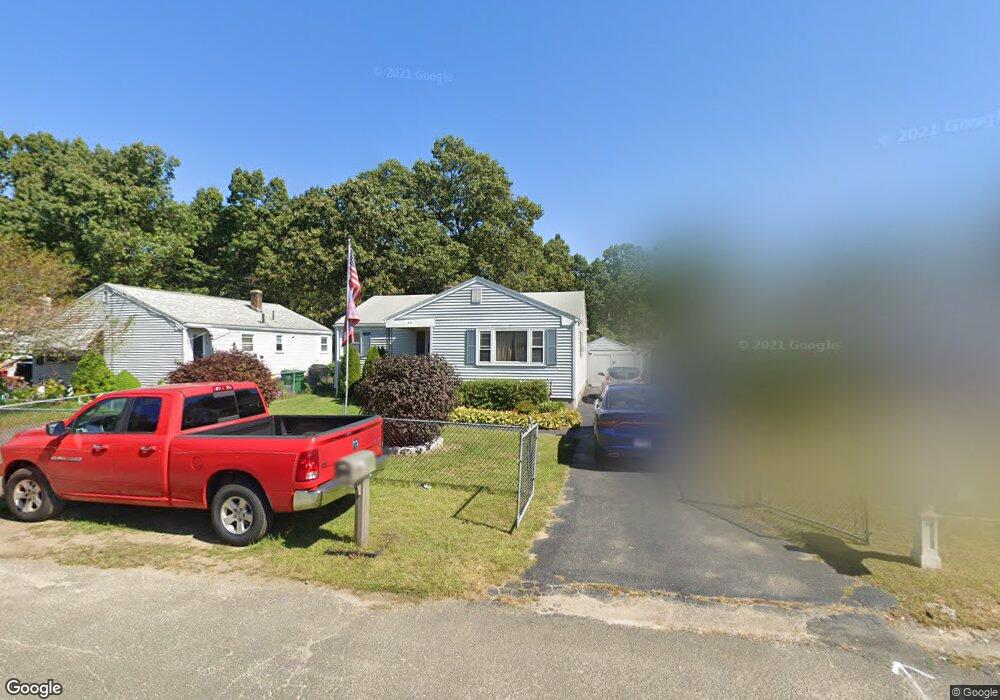
33 Julia Ave Chicopee, MA 01020
Aldenville NeighborhoodEstimated Value: $282,000 - $300,000
3
Beds
1
Bath
920
Sq Ft
$313/Sq Ft
Est. Value
About This Home
This home is located at 33 Julia Ave, Chicopee, MA 01020 and is currently estimated at $288,359, approximately $313 per square foot. 33 Julia Ave is a home located in Hampden County with nearby schools including Barry Elementary School, Bellamy Middle School, and Chicopee Comprehensive High School.
Ownership History
Date
Name
Owned For
Owner Type
Purchase Details
Closed on
Aug 13, 2004
Sold by
Bajor Todd N
Bought by
Gallant Michael W and Gallant Shawna L
Current Estimated Value
Home Financials for this Owner
Home Financials are based on the most recent Mortgage that was taken out on this home.
Original Mortgage
$128,250
Outstanding Balance
$64,272
Interest Rate
6.16%
Mortgage Type
Purchase Money Mortgage
Estimated Equity
$224,087
Purchase Details
Closed on
Mar 29, 2002
Sold by
Jones Brian H and Jones Sherry L
Bought by
Bajor Todd N
Home Financials for this Owner
Home Financials are based on the most recent Mortgage that was taken out on this home.
Original Mortgage
$84,800
Interest Rate
6.88%
Mortgage Type
Purchase Money Mortgage
Purchase Details
Closed on
Oct 13, 2000
Sold by
Celatka Theresa A
Bought by
Jones Brian H and Jones Sherry L
Purchase Details
Closed on
May 15, 1987
Sold by
Cloutier Michael
Bought by
Celatka William C
Create a Home Valuation Report for This Property
The Home Valuation Report is an in-depth analysis detailing your home's value as well as a comparison with similar homes in the area
Home Values in the Area
Average Home Value in this Area
Purchase History
| Date | Buyer | Sale Price | Title Company |
|---|---|---|---|
| Gallant Michael W | $135,000 | -- | |
| Bajor Todd N | $106,000 | -- | |
| Jones Brian H | $93,400 | -- | |
| Celatka William C | $78,900 | -- |
Source: Public Records
Mortgage History
| Date | Status | Borrower | Loan Amount |
|---|---|---|---|
| Open | Gallant Michael W | $128,250 | |
| Previous Owner | Celatka William C | $84,800 | |
| Previous Owner | Celatka William C | $21,200 | |
| Previous Owner | Celatka William C | $92,408 |
Source: Public Records
Tax History
| Year | Tax Paid | Tax Assessment Tax Assessment Total Assessment is a certain percentage of the fair market value that is determined by local assessors to be the total taxable value of land and additions on the property. | Land | Improvement |
|---|---|---|---|---|
| 2025 | $3,560 | $234,800 | $111,400 | $123,400 |
| 2024 | $3,377 | $228,800 | $109,200 | $119,600 |
| 2023 | $3,183 | $210,100 | $99,200 | $110,900 |
| 2022 | $3,040 | $178,900 | $86,300 | $92,600 |
| 2021 | $2,877 | $163,400 | $78,500 | $84,900 |
| 2020 | $2,739 | $156,900 | $77,700 | $79,200 |
| 2019 | $2,692 | $149,900 | $77,700 | $72,200 |
| 2018 | $2,624 | $143,300 | $74,000 | $69,300 |
| 2017 | $2,302 | $133,000 | $67,900 | $65,100 |
| 2016 | $2,344 | $138,600 | $67,900 | $70,700 |
| 2015 | $2,464 | $140,500 | $67,900 | $72,600 |
| 2014 | $1,232 | $140,500 | $67,900 | $72,600 |
Source: Public Records
Map
Nearby Homes
- 200 Lambert Terrace Unit 46
- 583 Mckinstry Ave
- 56 Percy St
- 26 Dayton St
- 541 Grattan St
- 269 Chicopee St Unit 6
- 87 Clarendon Ave
- 26 Whitin Ave
- 171 State St
- 76 Joy St
- 439 Oldfield Rd
- 11 Rolf Ave
- 51 Beaumont Ave
- 325 Granby Rd
- 27 Old Chicopee St
- 24 Daley St
- 86 Beaumont Ave
- 39 State St
- 87 Blanchwood Ave
- 46 Maplewood Ave
Your Personal Tour Guide
Ask me questions while you tour the home.