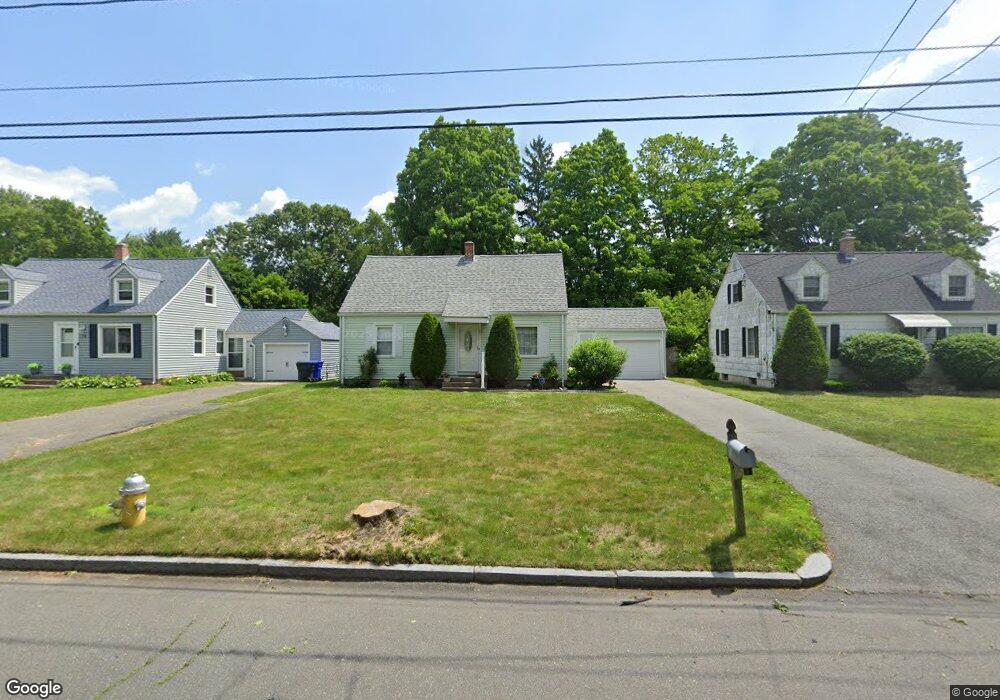
33 Lumae St Springfield, MA 01119
Sixteen Acres NeighborhoodEstimated Value: $310,320 - $352,000
4
Beds
2
Baths
1,527
Sq Ft
$222/Sq Ft
Est. Value
About This Home
This home is located at 33 Lumae St, Springfield, MA 01119 and is currently estimated at $339,080, approximately $222 per square foot. 33 Lumae St is a home located in Hampden County with nearby schools including Glickman Elementary, John J Duggan Middle, and Springfield High School of Science and Technology.
Ownership History
Date
Name
Owned For
Owner Type
Purchase Details
Closed on
Mar 29, 2006
Sold by
Carnegie Creigton P and Carnegie Deana M
Bought by
Carnegie Creigton P and Carnegie Deana M
Current Estimated Value
Home Financials for this Owner
Home Financials are based on the most recent Mortgage that was taken out on this home.
Original Mortgage
$173,271
Outstanding Balance
$99,343
Interest Rate
6.32%
Mortgage Type
Purchase Money Mortgage
Estimated Equity
$239,737
Purchase Details
Closed on
Nov 10, 2005
Sold by
Cross David R and Chapman Nicole E
Bought by
Carnegie Creighton P and Carnegie Deana M
Home Financials for this Owner
Home Financials are based on the most recent Mortgage that was taken out on this home.
Original Mortgage
$169,653
Interest Rate
5.93%
Mortgage Type
Purchase Money Mortgage
Purchase Details
Closed on
Mar 28, 2002
Sold by
Farland David A and Whittemore Joan M
Bought by
Chapman Nicole E and Cross David R
Home Financials for this Owner
Home Financials are based on the most recent Mortgage that was taken out on this home.
Original Mortgage
$100,000
Interest Rate
6.88%
Mortgage Type
Purchase Money Mortgage
Create a Home Valuation Report for This Property
The Home Valuation Report is an in-depth analysis detailing your home's value as well as a comparison with similar homes in the area
Home Values in the Area
Average Home Value in this Area
Purchase History
| Date | Buyer | Sale Price | Title Company |
|---|---|---|---|
| Carnegie Creigton P | -- | -- | |
| Carnegie Creighton P | $174,900 | -- | |
| Chapman Nicole E | $112,000 | -- |
Source: Public Records
Mortgage History
| Date | Status | Borrower | Loan Amount |
|---|---|---|---|
| Open | Carnegie Creigton P | $173,271 | |
| Previous Owner | Carnegie Creighton P | $169,653 | |
| Previous Owner | Chapman Nicole E | $100,000 | |
| Previous Owner | Chapman Nicole E | $10,000 |
Source: Public Records
Tax History
| Year | Tax Paid | Tax Assessment Tax Assessment Total Assessment is a certain percentage of the fair market value that is determined by local assessors to be the total taxable value of land and additions on the property. | Land | Improvement |
|---|---|---|---|---|
| 2025 | $3,994 | $254,700 | $51,400 | $203,300 |
| 2024 | $4,036 | $251,300 | $51,400 | $199,900 |
| 2023 | $3,465 | $203,200 | $49,000 | $154,200 |
| 2022 | $3,559 | $189,100 | $49,000 | $140,100 |
| 2021 | $3,294 | $174,300 | $44,500 | $129,800 |
| 2020 | $3,312 | $169,600 | $44,500 | $125,100 |
| 2019 | $3,208 | $163,000 | $44,500 | $118,500 |
| 2018 | $3,243 | $164,800 | $44,500 | $120,300 |
| 2017 | $2,994 | $152,300 | $44,000 | $108,300 |
| 2016 | $2,908 | $147,900 | $44,000 | $103,900 |
| 2015 | $2,888 | $146,800 | $44,000 | $102,800 |
Source: Public Records
Map
Nearby Homes
- Lot 37 Kane St
- 39 Groton St
- 186 Bolton St
- 235 Starling Rd
- 121 Mallowhill Rd
- 88 Senator St
- 244 Nassau Dr Unit 244
- 25 Nassau Dr Unit 25
- 72 Nassau Dr
- 173 Nassau Dr
- 38 Northway Dr
- 367 Nassau Dr Unit 367
- 854 Grayson Dr
- 74 Valley Rd
- 31 Acrebrook Rd
- 56 Rosemary Dr
- 130 Spear Rd
- 19 Annies Way
- 119 Acrebrook Rd
- 56 Contessa Ln
Your Personal Tour Guide
Ask me questions while you tour the home.