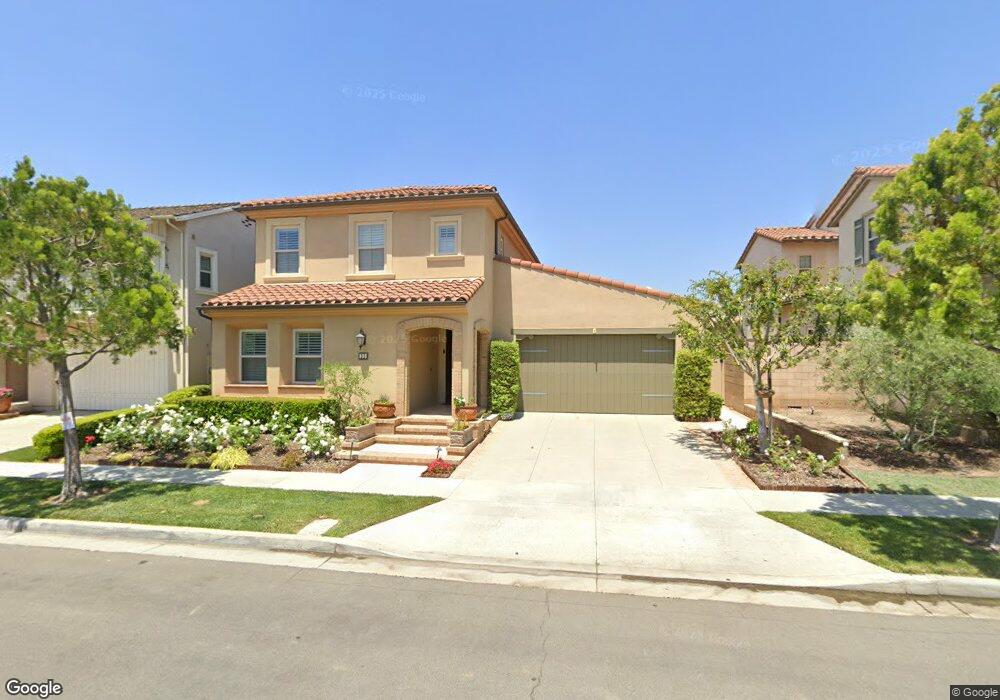
33 Skyward Irvine, CA 92620
Woodbury and Stonegate NeighborhoodEstimated Value: $2,633,013 - $3,311,000
4
Beds
4
Baths
3,243
Sq Ft
$906/Sq Ft
Est. Value
About This Home
This home is located at 33 Skyward, Irvine, CA 92620 and is currently estimated at $2,937,503, approximately $905 per square foot. 33 Skyward is a home with nearby schools including Jeffrey Trail Middle, Portola High School, and New Horizon Elementary School.
Ownership History
Date
Name
Owned For
Owner Type
Purchase Details
Closed on
Jul 5, 2023
Sold by
Chien Family Trust
Bought by
Chien Family Trust and Chien
Current Estimated Value
Home Financials for this Owner
Home Financials are based on the most recent Mortgage that was taken out on this home.
Original Mortgage
$897,000
Outstanding Balance
$874,714
Interest Rate
6.57%
Mortgage Type
Credit Line Revolving
Estimated Equity
$2,062,789
Purchase Details
Closed on
Aug 13, 2019
Sold by
Chien Kehsy and Zhou Mei Rong
Bought by
The Chien Family Trust
Purchase Details
Closed on
Mar 9, 2011
Sold by
The New Home Company Southern California
Bought by
Chien Kehsy and Zhou Mei Rong
Home Financials for this Owner
Home Financials are based on the most recent Mortgage that was taken out on this home.
Original Mortgage
$726,800
Interest Rate
3.85%
Mortgage Type
Adjustable Rate Mortgage/ARM
Create a Home Valuation Report for This Property
The Home Valuation Report is an in-depth analysis detailing your home's value as well as a comparison with similar homes in the area
Home Values in the Area
Average Home Value in this Area
Purchase History
| Date | Buyer | Sale Price | Title Company |
|---|---|---|---|
| Chien Family Trust | -- | Fidelity National Title | |
| The Chien Family Trust | -- | None Available | |
| Chien Kehsy | $1,118,500 | First American Title Company |
Source: Public Records
Mortgage History
| Date | Status | Borrower | Loan Amount |
|---|---|---|---|
| Open | Chien Family Trust | $897,000 | |
| Previous Owner | Chien Kehsy | $726,800 |
Source: Public Records
Tax History
| Year | Tax Paid | Tax Assessment Tax Assessment Total Assessment is a certain percentage of the fair market value that is determined by local assessors to be the total taxable value of land and additions on the property. | Land | Improvement |
|---|---|---|---|---|
| 2025 | $17,398 | $1,432,667 | $797,317 | $635,350 |
| 2024 | $17,398 | $1,404,576 | $781,683 | $622,893 |
| 2023 | $17,747 | $1,377,036 | $766,356 | $610,680 |
| 2022 | $17,364 | $1,350,036 | $751,330 | $598,706 |
| 2021 | $17,067 | $1,323,565 | $736,598 | $586,967 |
| 2020 | $16,930 | $1,309,994 | $729,045 | $580,949 |
| 2019 | $17,453 | $1,284,308 | $714,750 | $569,558 |
| 2018 | $17,187 | $1,259,126 | $700,735 | $558,391 |
| 2017 | $16,915 | $1,234,438 | $686,995 | $547,443 |
| 2016 | $16,897 | $1,210,234 | $673,525 | $536,709 |
| 2015 | $16,687 | $1,192,056 | $663,408 | $528,648 |
| 2014 | $16,434 | $1,168,706 | $650,413 | $518,293 |
Source: Public Records
Map
Nearby Homes
- 57 Statuary
- 65 Rolling Green
- 71 Clocktower
- 2 Conifer
- 113 Hanging Gardens
- 35 Twin Gables
- 149 Great Park Blvd
- 79 Field Poppy
- 37 Peony
- 70 Twin Gables
- 125 Strawberry Grove
- 40 Waterspout
- 97 Twin Gables
- 142 Hedge Bloom Unit 83
- 320 Bronze
- 79 Thornapple
- 22 Sanctuary
- 67 Sanctuary
- 17 City Stroll
- 81 Island Coral
Your Personal Tour Guide
Ask me questions while you tour the home.