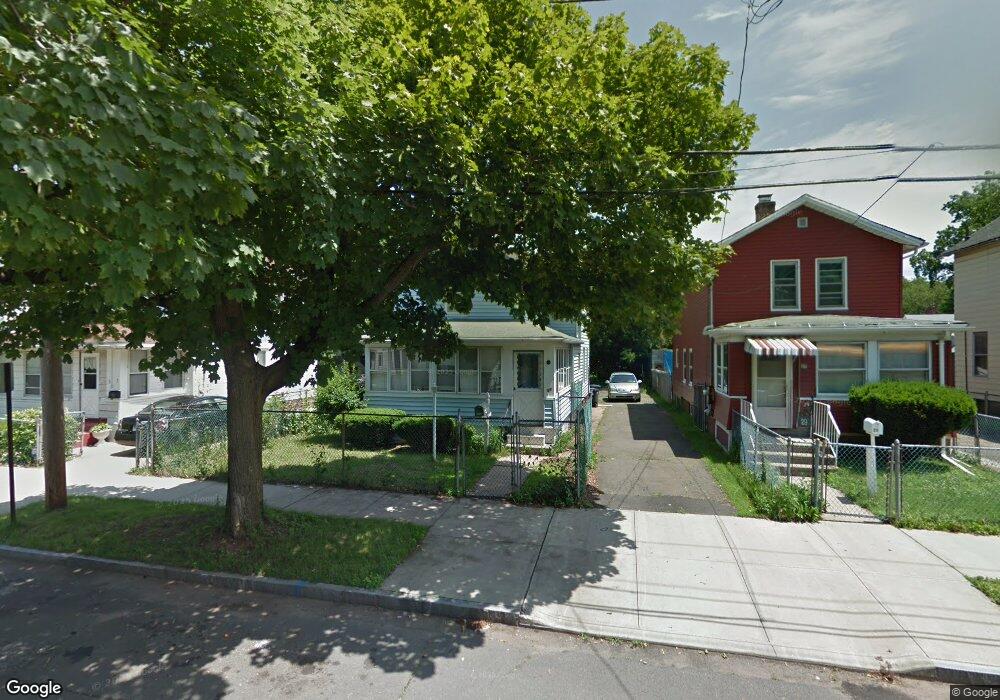
33 Watson St New Haven, CT 06511
Newhallville NeighborhoodEstimated Value: $192,000 - $304,000
3
Beds
1
Bath
1,393
Sq Ft
$180/Sq Ft
Est. Value
About This Home
This home is located at 33 Watson St, New Haven, CT 06511 and is currently estimated at $251,281, approximately $180 per square foot. 33 Watson St is a home located in New Haven County with nearby schools including Highville Charter School and The Foote School.
Ownership History
Date
Name
Owned For
Owner Type
Purchase Details
Closed on
Feb 8, 2008
Sold by
Us Bank Na
Bought by
Rogers Eric
Current Estimated Value
Home Financials for this Owner
Home Financials are based on the most recent Mortgage that was taken out on this home.
Original Mortgage
$98,500
Outstanding Balance
$62,585
Interest Rate
6.2%
Estimated Equity
$188,696
Purchase Details
Closed on
Jan 24, 2002
Sold by
Clayton Brenda
Bought by
Alvarez Gilberto and Dejesus Rosalina
Create a Home Valuation Report for This Property
The Home Valuation Report is an in-depth analysis detailing your home's value as well as a comparison with similar homes in the area
Home Values in the Area
Average Home Value in this Area
Purchase History
| Date | Buyer | Sale Price | Title Company |
|---|---|---|---|
| Rogers Eric | $99,000 | -- | |
| Alvarez Gilberto | $67,000 | -- |
Source: Public Records
Mortgage History
| Date | Status | Borrower | Loan Amount |
|---|---|---|---|
| Closed | Alvarez Gilberto | $23,280 | |
| Open | Alvarez Gilberto | $98,500 | |
| Previous Owner | Alvarez Gilberto | $162,900 |
Source: Public Records
Tax History
| Year | Tax Paid | Tax Assessment Tax Assessment Total Assessment is a certain percentage of the fair market value that is determined by local assessors to be the total taxable value of land and additions on the property. | Land | Improvement |
|---|---|---|---|---|
| 2025 | $4,901 | $124,390 | $32,970 | $91,420 |
| 2024 | $4,789 | $124,390 | $32,970 | $91,420 |
| 2023 | $4,627 | $124,390 | $32,970 | $91,420 |
| 2022 | $4,945 | $124,390 | $32,970 | $91,420 |
| 2021 | $3,526 | $80,360 | $26,390 | $53,970 |
| 2020 | $3,526 | $80,360 | $26,390 | $53,970 |
| 2019 | $3,454 | $80,360 | $26,390 | $53,970 |
| 2018 | $3,454 | $80,360 | $26,390 | $53,970 |
| 2017 | $3,108 | $80,360 | $26,390 | $53,970 |
| 2016 | $2,603 | $62,650 | $11,690 | $50,960 |
| 2015 | $2,603 | $62,650 | $11,690 | $50,960 |
| 2014 | $2,603 | $62,650 | $11,690 | $50,960 |
Source: Public Records
Map
Nearby Homes
- 24 Watson St
- 407 Shelton Ave
- 773 Dixwell Ave
- 48 Alling St
- 201 Ivy St
- 26 Lander St
- 251 Starr St
- 254 Starr St
- 780 Winchester Ave
- 118 Cherry Ann St
- 622 Winchester Ave
- 1002 Winchester Ave
- 171 Morse St
- 40 Harding Place
- 126 Sheffield Ave
- 59 Pine St
- 449 Dixwell Ave
- 131 Bryden Terrace
- 437 Dixwell Ave
- 431 Dixwell Ave
Your Personal Tour Guide
Ask me questions while you tour the home.