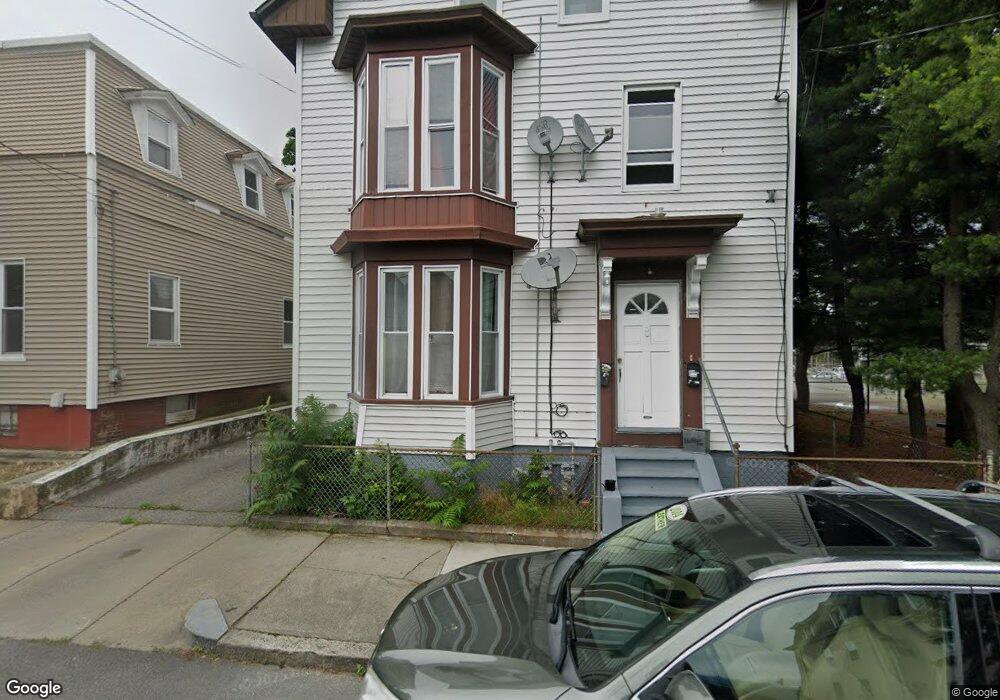
33 Whipple Ave Cranston, RI 02920
Arlington NeighborhoodEstimated Value: $398,973 - $472,000
4
Beds
2
Baths
2,400
Sq Ft
$188/Sq Ft
Est. Value
About This Home
This home is located at 33 Whipple Ave, Cranston, RI 02920 and is currently estimated at $451,743, approximately $188 per square foot. 33 Whipple Ave is a home located in Providence County with nearby schools including Hugh B. Bain Middle School, Cranston High School East, and Achievement First Iluminar Mayoral Academy.
Ownership History
Date
Name
Owned For
Owner Type
Purchase Details
Closed on
Feb 13, 2009
Sold by
Homesales Inc
Bought by
Lei Zi Zhung
Current Estimated Value
Purchase Details
Closed on
Oct 27, 2008
Sold by
Hernandez Ramon E
Bought by
Home Sales Inc
Purchase Details
Closed on
Jan 31, 1997
Sold by
Lema Rita L
Bought by
Hernandez Ramon E and Hernandez Elizabeth
Home Financials for this Owner
Home Financials are based on the most recent Mortgage that was taken out on this home.
Original Mortgage
$64,673
Interest Rate
7.65%
Create a Home Valuation Report for This Property
The Home Valuation Report is an in-depth analysis detailing your home's value as well as a comparison with similar homes in the area
Home Values in the Area
Average Home Value in this Area
Purchase History
| Date | Buyer | Sale Price | Title Company |
|---|---|---|---|
| Lei Zi Zhung | $75,000 | -- | |
| Home Sales Inc | $135,000 | -- | |
| Hernandez Ramon E | $65,000 | -- |
Source: Public Records
Mortgage History
| Date | Status | Borrower | Loan Amount |
|---|---|---|---|
| Open | Hernandez Ramon E | $100,500 | |
| Previous Owner | Hernandez Ramon E | $229,500 | |
| Previous Owner | Hernandez Ramon E | $195,000 | |
| Previous Owner | Hernandez Ramon E | $64,673 |
Source: Public Records
Tax History Compared to Growth
Tax History
| Year | Tax Paid | Tax Assessment Tax Assessment Total Assessment is a certain percentage of the fair market value that is determined by local assessors to be the total taxable value of land and additions on the property. | Land | Improvement |
|---|---|---|---|---|
| 2025 | $4,893 | $352,500 | $101,300 | $251,200 |
| 2024 | $4,798 | $352,500 | $101,300 | $251,200 |
| 2023 | $4,150 | $219,600 | $44,500 | $175,100 |
| 2022 | $4,065 | $219,600 | $44,500 | $175,100 |
| 2021 | $3,953 | $219,600 | $44,500 | $175,100 |
| 2020 | $3,606 | $173,600 | $34,900 | $138,700 |
| 2019 | $3,606 | $173,600 | $34,900 | $138,700 |
| 2018 | $3,522 | $173,600 | $34,900 | $138,700 |
| 2017 | $2,700 | $117,700 | $15,900 | $101,800 |
| 2016 | $2,642 | $117,700 | $15,900 | $101,800 |
| 2015 | $2,642 | $117,700 | $15,900 | $101,800 |
| 2014 | $2,483 | $108,700 | $15,900 | $92,800 |
Source: Public Records
Map
Nearby Homes
- 17 Birch St
- 16 Ruzzi St
- 121 Heather St
- 63 Lincoln Ave
- 470 Laurel Hill Ave
- 372 Farmington Ave
- 87 Dunedin St
- 95 Elwyn St
- 121 Hillwood St
- 293 Webster Ave
- 127 Gladstone St
- 231 Union Ave
- 30 Pomham St
- 318 Princess Ave
- 454 Union Ave
- 355 Laurel Hill Ave
- 14 Shafter St
- 79 Priscilla Ave
- 0 Princess Ave
- 12 Winthrop St