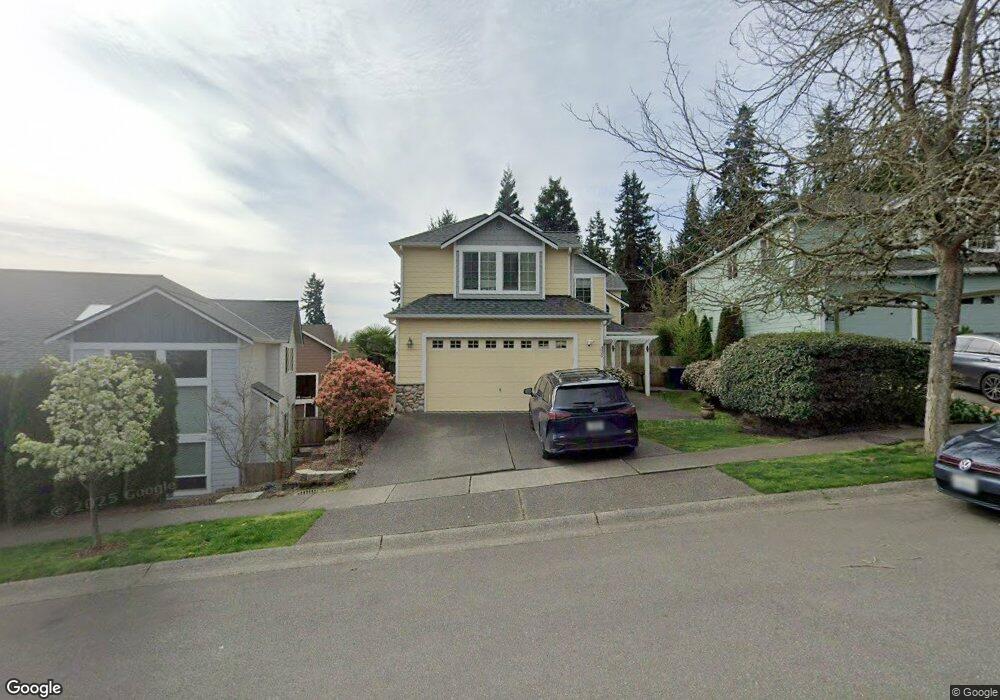
330 170th Place SE Bothell, WA 98012
Estimated Value: $957,371 - $1,093,000
4
Beds
3
Baths
2,368
Sq Ft
$431/Sq Ft
Est. Value
About This Home
This home is located at 330 170th Place SE, Bothell, WA 98012 and is currently estimated at $1,021,593, approximately $431 per square foot. 330 170th Place SE is a home located in Snohomish County with nearby schools including Oak Heights Elementary School, Alderwood Middle School, and Lynnwood High School.
Ownership History
Date
Name
Owned For
Owner Type
Purchase Details
Closed on
Oct 12, 2015
Sold by
Collins Deana Marie
Bought by
Nabholz Trevor and Wlodawer Joanna
Current Estimated Value
Home Financials for this Owner
Home Financials are based on the most recent Mortgage that was taken out on this home.
Original Mortgage
$373,250
Outstanding Balance
$289,404
Interest Rate
3.86%
Mortgage Type
New Conventional
Estimated Equity
$732,189
Purchase Details
Closed on
Jun 24, 2010
Sold by
Fenton Donald L
Bought by
Collins Deana M and Fenton Deana M
Purchase Details
Closed on
Aug 15, 2002
Sold by
Moe Homes Inc
Bought by
Fenton Don L and Collins Deana M
Home Financials for this Owner
Home Financials are based on the most recent Mortgage that was taken out on this home.
Original Mortgage
$239,960
Interest Rate
5.25%
Create a Home Valuation Report for This Property
The Home Valuation Report is an in-depth analysis detailing your home's value as well as a comparison with similar homes in the area
Home Values in the Area
Average Home Value in this Area
Purchase History
| Date | Buyer | Sale Price | Title Company |
|---|---|---|---|
| Nabholz Trevor | $395,000 | First American | |
| Collins Deana M | -- | None Available | |
| Fenton Don L | $299,950 | -- |
Source: Public Records
Mortgage History
| Date | Status | Borrower | Loan Amount |
|---|---|---|---|
| Open | Nabholz Trevor | $373,250 | |
| Previous Owner | Fenton Don L | $239,960 | |
| Closed | Fenton Don L | $30,000 |
Source: Public Records
Tax History
| Year | Tax Paid | Tax Assessment Tax Assessment Total Assessment is a certain percentage of the fair market value that is determined by local assessors to be the total taxable value of land and additions on the property. | Land | Improvement |
|---|---|---|---|---|
| 2025 | $6,817 | $860,000 | $525,000 | $335,000 |
| 2024 | $6,817 | $828,400 | $505,000 | $323,400 |
| 2023 | $7,804 | $994,900 | $590,000 | $404,900 |
| 2022 | $6,794 | $703,700 | $360,000 | $343,700 |
| 2020 | $6,449 | $589,400 | $294,000 | $295,400 |
| 2019 | $5,461 | $495,600 | $243,000 | $252,600 |
| 2018 | $5,445 | $435,400 | $210,000 | $225,400 |
| 2017 | $4,652 | $385,000 | $175,000 | $210,000 |
| 2016 | $4,995 | $416,500 | $160,000 | $256,500 |
| 2015 | $4,955 | $392,800 | $140,000 | $252,800 |
| 2013 | $3,818 | $286,200 | $107,000 | $179,200 |
Source: Public Records
Map
Nearby Homes
- 16719 1st Ave SE
- 16610 3rd Dr SE
- 16528 2nd Park SE
- 16526 1st Park SE
- 17419 Gravenstein Rd
- 122 169th Place SW Unit B
- 114 169th Place SW Unit B
- 110 169th Place SW Unit A
- 207 169th Place SW
- 16230 3rd Ave SE Unit A1
- 17723 3rd Ave SE
- 16228 2nd Ave SE
- 107 164th St SE Unit 2103
- 107 164th St SE Unit 2-301
- 109 161st Place SE
- 15 164th St SW Unit 2
- 1325 Seattle Hill Rd Unit A2
- 1325 Seattle Hill Rd Unit A3
- 1325 Seattle Hill Rd Unit L2
- 1313 173rd Place SE
- 324 170th Place SE
- 324 170th Place SE
- 17010 4th Ave SE
- 17004 4th Ave SE
- 316 170th Place SE
- 17033 3rd Ave SE
- 17014 4th Ave SE
- 322 171st St SE
- 318 171st St SE
- 308 170th Place SE
- 314 171st St SE
- 314 171st St SE
- 416 171st St SE
- 304 170th Place SE
- 325 170th Place SE
- 309 170th Place SE
- 3323 170th Place SE
- 17011 4th Ave SE
- 17007 4th Ave SE
- 17011 4th Ave SE
Your Personal Tour Guide
Ask me questions while you tour the home.