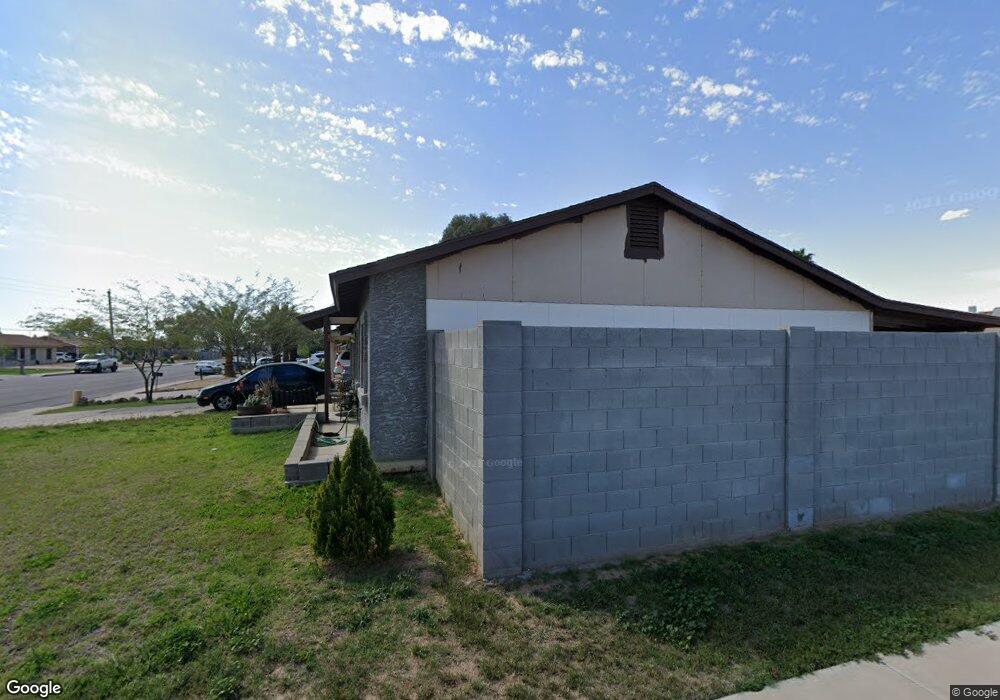
3302 W Grovers Ave Phoenix, AZ 85053
Deer Valley NeighborhoodEstimated Value: $289,142 - $359,000
--
Bed
2
Baths
1,228
Sq Ft
$270/Sq Ft
Est. Value
About This Home
This home is located at 3302 W Grovers Ave, Phoenix, AZ 85053 and is currently estimated at $331,536, approximately $269 per square foot. 3302 W Grovers Ave is a home located in Maricopa County with nearby schools including Sunrise Elementary School, Desert Sky Middle School, and Deer Valley High School.
Ownership History
Date
Name
Owned For
Owner Type
Purchase Details
Closed on
Oct 13, 2003
Sold by
Mulholland Kelly E
Bought by
Crowley Ryan T
Current Estimated Value
Home Financials for this Owner
Home Financials are based on the most recent Mortgage that was taken out on this home.
Original Mortgage
$79,515
Interest Rate
6.04%
Mortgage Type
Purchase Money Mortgage
Purchase Details
Closed on
Mar 29, 1999
Sold by
Eskew Paul and Eskew Joanne
Bought by
Crowley Ryan T and Mulholland Kelly E
Home Financials for this Owner
Home Financials are based on the most recent Mortgage that was taken out on this home.
Original Mortgage
$82,353
Interest Rate
6.79%
Mortgage Type
New Conventional
Purchase Details
Closed on
Dec 30, 1998
Sold by
Vanover Marvin D and Rayna Vanover K
Bought by
Eskew Paul and Eskew Joanne
Create a Home Valuation Report for This Property
The Home Valuation Report is an in-depth analysis detailing your home's value as well as a comparison with similar homes in the area
Home Values in the Area
Average Home Value in this Area
Purchase History
| Date | Buyer | Sale Price | Title Company |
|---|---|---|---|
| Crowley Ryan T | -- | First American Title Ins Co | |
| Crowley Ryan T | $84,900 | Security Title Agency | |
| Eskew Paul | -- | -- |
Source: Public Records
Mortgage History
| Date | Status | Borrower | Loan Amount |
|---|---|---|---|
| Previous Owner | Crowley Ryan T | $79,515 | |
| Previous Owner | Crowley Ryan T | $82,353 | |
| Closed | Crowley Ryan T | $18,000 |
Source: Public Records
Tax History Compared to Growth
Tax History
| Year | Tax Paid | Tax Assessment Tax Assessment Total Assessment is a certain percentage of the fair market value that is determined by local assessors to be the total taxable value of land and additions on the property. | Land | Improvement |
|---|---|---|---|---|
| 2025 | $710 | $8,248 | -- | -- |
| 2024 | $698 | $7,855 | -- | -- |
| 2023 | $698 | $24,210 | $4,840 | $19,370 |
| 2022 | $672 | $18,520 | $3,700 | $14,820 |
| 2021 | $702 | $16,780 | $3,350 | $13,430 |
| 2020 | $689 | $15,680 | $3,130 | $12,550 |
| 2019 | $668 | $14,000 | $2,800 | $11,200 |
| 2018 | $645 | $12,610 | $2,520 | $10,090 |
| 2017 | $622 | $10,670 | $2,130 | $8,540 |
| 2016 | $587 | $10,310 | $2,060 | $8,250 |
| 2015 | $524 | $9,460 | $1,890 | $7,570 |
Source: Public Records
Map
Nearby Homes
- 3331 W Libby St
- 17809 N 34th Ave
- 3209 W Charleston Ave
- 3227 W Villa Rita Dr
- 18031 N 33rd Ave
- 3150 W Michelle Dr
- 17848 N 34th Ln
- 18002 N 31st Dr
- 18415 N 33rd Ave
- 3019 W Libby St
- 3222 W Wagoner Rd Unit 3
- 3016 W Libby St
- 3131 W Campo Bello Dr
- 3021 W Angela Dr
- 2957 W Villa Rita Dr
- 3008 W Michigan Ave
- 3330 W Danbury Dr Unit E203
- 3434 W Danbury Dr Unit 103
- 3434 W Danbury Dr Unit 204
- 2941 W Michigan Ave
- 3310 W Grovers Ave
- 3301 W Libby St
- 3309 W Libby St
- 3256 W Grovers Ave
- 3316 W Grovers Ave
- 3257 W Libby St
- 3315 W Libby St
- 3320 W Grovers Ave
- 3301 W Grovers Ave
- 3261 W Grovers Ave
- 3321 W Libby St
- 3251 W Libby St
- 3309 W Grovers Ave
- 17826 N 33rd Ave
- 3255 W Grovers Ave
- 3315 W Grovers Ave
- 3326 W Grovers Ave
- 3244 W Grovers Ave
- 17820 N 33rd Dr
- 3249 W Grovers Ave