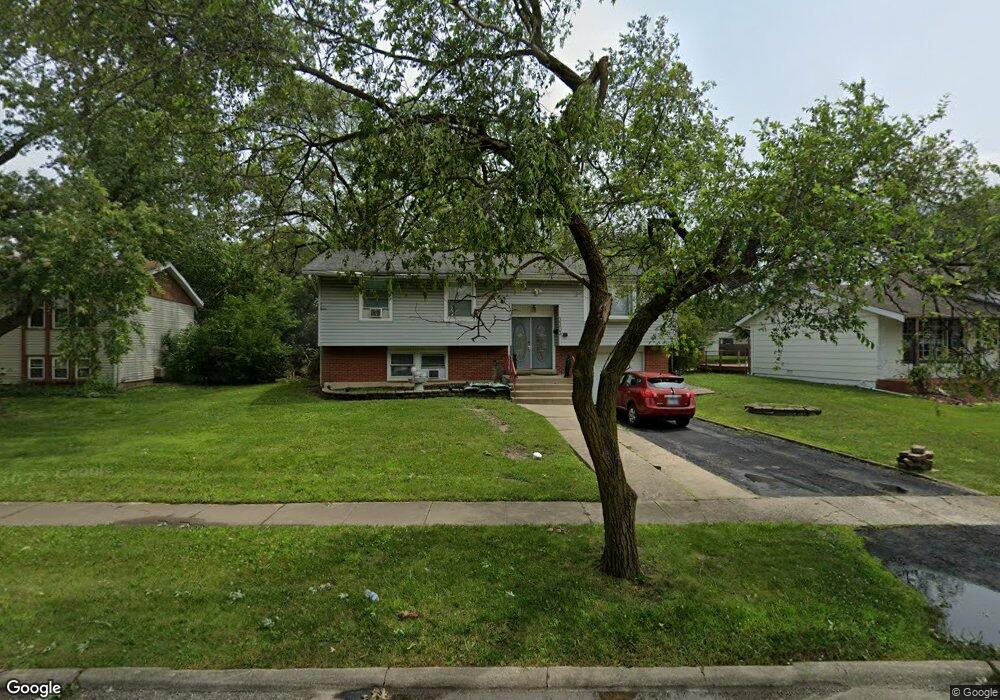
3303 Tulip Dr Hazel Crest, IL 60429
Estimated Value: $172,000 - $214,000
3
Beds
2
Baths
1,150
Sq Ft
$168/Sq Ft
Est. Value
About This Home
This home is located at 3303 Tulip Dr, Hazel Crest, IL 60429 and is currently estimated at $192,771, approximately $167 per square foot. 3303 Tulip Dr is a home located in Cook County with nearby schools including Highlands Elementary School, Prairie-Hills Junior High School, and Hillcrest High School.
Ownership History
Date
Name
Owned For
Owner Type
Purchase Details
Closed on
Jul 20, 2001
Sold by
Crites Morris Monica M and Morris Franklin D
Bought by
Crites Morris Monica M
Current Estimated Value
Home Financials for this Owner
Home Financials are based on the most recent Mortgage that was taken out on this home.
Original Mortgage
$101,768
Outstanding Balance
$37,879
Interest Rate
7.15%
Mortgage Type
FHA
Estimated Equity
$154,892
Purchase Details
Closed on
Sep 8, 2000
Sold by
Morris Franklin D and Morris Yolanda
Bought by
Morris Franklin D and Crites Morris Monica M
Home Financials for this Owner
Home Financials are based on the most recent Mortgage that was taken out on this home.
Original Mortgage
$92,000
Interest Rate
10.5%
Purchase Details
Closed on
Oct 23, 1996
Sold by
Bankers Trust California
Bought by
Morris Yolanda and Morris Franklin D
Purchase Details
Closed on
Feb 24, 1994
Sold by
Va
Bought by
Bankers Trust Company Of California Na
Create a Home Valuation Report for This Property
The Home Valuation Report is an in-depth analysis detailing your home's value as well as a comparison with similar homes in the area
Home Values in the Area
Average Home Value in this Area
Purchase History
| Date | Buyer | Sale Price | Title Company |
|---|---|---|---|
| Crites Morris Monica M | -- | -- | |
| Morris Franklin D | $115,000 | Chicago Title Insurance Co | |
| Morris Yolanda | $31,000 | -- | |
| Bankers Trust Company Of California Na | -- | -- |
Source: Public Records
Mortgage History
| Date | Status | Borrower | Loan Amount |
|---|---|---|---|
| Open | Crites Morris Monica M | $101,768 | |
| Closed | Morris Franklin D | $92,000 | |
| Closed | Morris Franklin D | $17,250 |
Source: Public Records
Tax History
| Year | Tax Paid | Tax Assessment Tax Assessment Total Assessment is a certain percentage of the fair market value that is determined by local assessors to be the total taxable value of land and additions on the property. | Land | Improvement |
|---|---|---|---|---|
| 2025 | $4,449 | $12,000 | $2,724 | $9,276 |
| 2024 | $4,449 | $12,000 | $2,724 | $9,276 |
| 2023 | $4,013 | $12,000 | $2,724 | $9,276 |
| 2022 | $4,013 | $8,887 | $2,305 | $6,582 |
| 2021 | $3,932 | $8,887 | $2,305 | $6,582 |
| 2020 | $3,886 | $8,887 | $2,305 | $6,582 |
| 2019 | $3,360 | $8,448 | $2,095 | $6,353 |
| 2018 | $3,252 | $8,448 | $2,095 | $6,353 |
| 2017 | $3,075 | $8,448 | $2,095 | $6,353 |
| 2016 | $2,748 | $7,198 | $1,885 | $5,313 |
| 2015 | $2,562 | $7,198 | $1,885 | $5,313 |
| 2014 | $2,529 | $7,198 | $1,885 | $5,313 |
| 2013 | $2,591 | $8,039 | $1,885 | $6,154 |
Source: Public Records
Map
Nearby Homes
- 3319 Tulip Dr
- 3318 Tulip Dr
- 3321 Tulip Dr
- 3214 Birchwood Dr
- 17007 Elm Dr
- 3312 Maple Ln
- 3316 Birchwood Dr
- 17113 Elm Dr
- 3425 Birchwood Dr
- 17005 Albany Ave Unit 102
- 3509 Birchwood Dr
- 3511 Laurel Ln
- 3213 Woodworth Place
- 3012 171st St Unit GT
- 17006 Novak Dr Unit T107
- 17206 Elm Dr
- 3124 173rd St
- 17306 Burr Oak Ln
- 3321 173rd St
- 16641 Sawyer Ave
Your Personal Tour Guide
Ask me questions while you tour the home.