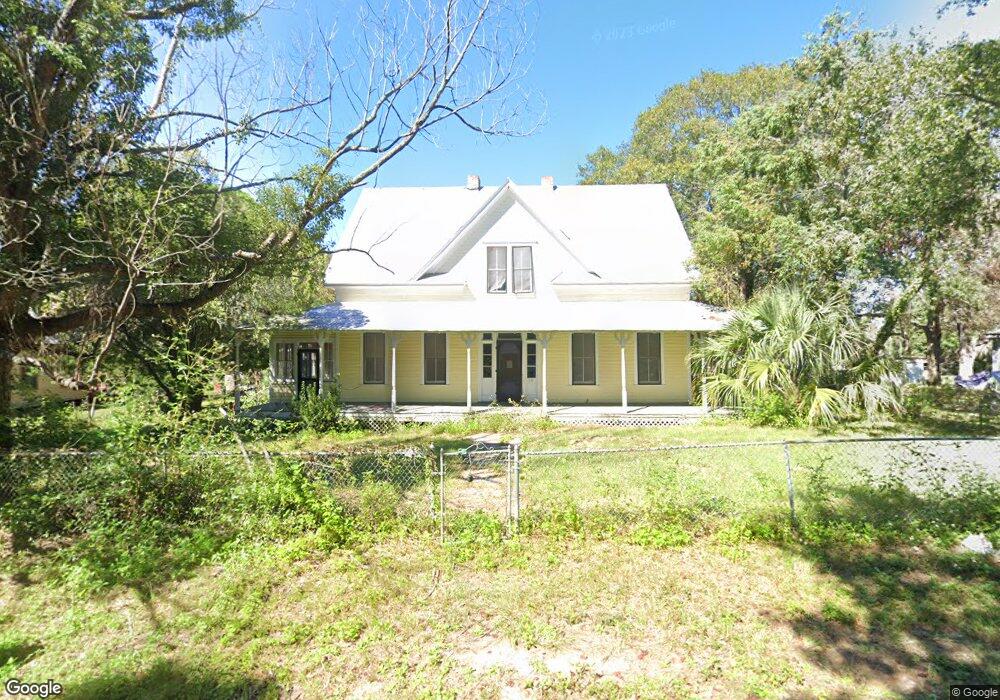
331 NE Central Ave Blackshear, GA 31516
Estimated Value: $111,000 - $253,000
4
Beds
3
Baths
3,444
Sq Ft
$43/Sq Ft
Est. Value
About This Home
This home is located at 331 NE Central Ave, Blackshear, GA 31516 and is currently estimated at $148,207, approximately $43 per square foot. 331 NE Central Ave is a home located in Pierce County with nearby schools including Pierce County High School, Southeast Christian Academy, and Truth Christian Academy.
Ownership History
Date
Name
Owned For
Owner Type
Purchase Details
Closed on
Feb 23, 2023
Sold by
Secretary Of Housing & Urban Dev Of Wash
Bought by
Santos Arnel
Current Estimated Value
Purchase Details
Closed on
Mar 1, 2022
Sold by
Bell Marquce Vidal
Bought by
Newrez Llc
Purchase Details
Closed on
Mar 17, 2017
Sold by
Roberson Jim
Bought by
Bell Marquce Vidal
Home Financials for this Owner
Home Financials are based on the most recent Mortgage that was taken out on this home.
Original Mortgage
$95,733
Interest Rate
4.62%
Mortgage Type
FHA
Purchase Details
Closed on
Jul 18, 2016
Sold by
Jason
Bought by
Luo Yuzhen
Purchase Details
Closed on
Mar 16, 2012
Sold by
Boyett Emma D
Bought by
Dixon Jason Boyett
Purchase Details
Closed on
Jun 17, 1988
Sold by
Boyett G C
Bought by
Boyett Emma D
Purchase Details
Closed on
Sep 8, 1987
Sold by
Knepton Anna Elizabeth Darling Etal
Bought by
First Methodist Church Of Blackshear
Create a Home Valuation Report for This Property
The Home Valuation Report is an in-depth analysis detailing your home's value as well as a comparison with similar homes in the area
Home Values in the Area
Average Home Value in this Area
Purchase History
| Date | Buyer | Sale Price | Title Company |
|---|---|---|---|
| Santos Arnel | $65,532 | -- | |
| Newrez Llc | $128,250 | -- | |
| Bell Marquce Vidal | $97,500 | -- | |
| Luo Yuzhen | -- | -- | |
| Roberson Jim | $9,800 | -- | |
| Dixon Jason Boyett | -- | -- | |
| Boyett Emma D | -- | -- | |
| First Methodist Church Of Blackshear | -- | -- |
Source: Public Records
Mortgage History
| Date | Status | Borrower | Loan Amount |
|---|---|---|---|
| Previous Owner | Bell Marquce Vidal | $95,733 |
Source: Public Records
Tax History
| Year | Tax Paid | Tax Assessment Tax Assessment Total Assessment is a certain percentage of the fair market value that is determined by local assessors to be the total taxable value of land and additions on the property. | Land | Improvement |
|---|---|---|---|---|
| 2025 | $2,692 | $81,553 | $3,810 | $77,743 |
| 2024 | $2,554 | $79,632 | $3,810 | $75,822 |
| 2023 | $2,523 | $78,672 | $3,810 | $74,862 |
| 2022 | $1,685 | $44,354 | $2,953 | $41,401 |
| 2021 | $1,742 | $42,600 | $2,953 | $39,647 |
| 2020 | $1,692 | $40,845 | $2,953 | $37,892 |
| 2019 | $1,691 | $40,845 | $2,953 | $37,892 |
| 2018 | $1,619 | $39,071 | $2,953 | $36,118 |
| 2017 | $610 | $14,642 | $2,953 | $11,689 |
| 2016 | $608 | $14,642 | $2,953 | $11,689 |
| 2015 | $433 | $14,641 | $2,953 | $11,689 |
| 2014 | $433 | $14,642 | $2,953 | $11,689 |
| 2013 | $433 | $14,641 | $2,952 | $11,688 |
Source: Public Records
Map
Nearby Homes
- 331 Central Ave W
- ST. ROUTE 121 Georgia 121
- 420 Greenleaf St
- 241 Strickland Ave
- 6034 Turkey Oak Rd
- 622 E Main St
- 315 Strickland Ave
- 543 Church St
- 402 Mcgregor St
- 106 Southern Oaks Ln
- 517 Lazy Ln
- 150 Pittman St
- 854 Jenkins St
- 918 Main St
- 121 Beaver Dr
- 915 Jane St
- 948 Azalea St
- TBD Trudie Rd
- 118 Pinehurst Dr
- 121 Trapper Trail
- 341 NE Central Ave
- 323 NE Central Ave
- 214 Darling St
- 210 Darling St
- 405 NE Central Ave
- 405 NE Central Ave
- 315 NE Central Ave
- 3667 U S 84
- 211 Darling Ave
- 3661 Us Highway 84
- 219 Darling St
- 3653 Us Highway 84
- 211 Darling St
- 413 NE Central Ave
- 305 Central Ave E
- 3687 Us Highway 84
- 3689 Us Highway 84
- 3648 Us Highway 84
- 3693 Us Highway 84
- 293 NE Central Ave
Your Personal Tour Guide
Ask me questions while you tour the home.