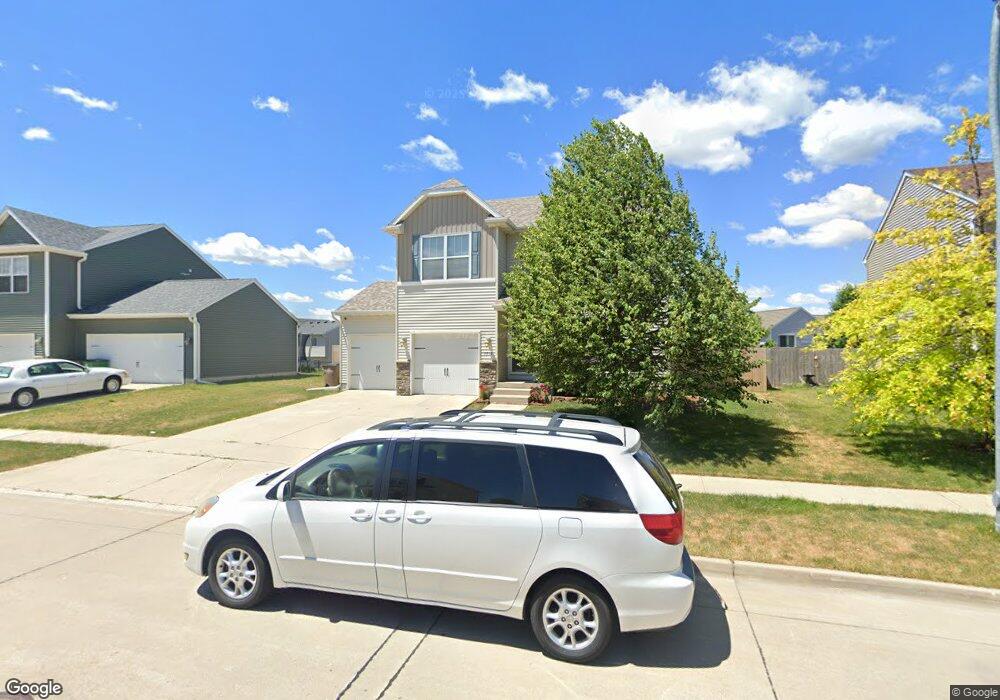
3312 Maple St SW Bondurant, IA 50035
Estimated Value: $304,000 - $335,000
4
Beds
3
Baths
1,752
Sq Ft
$181/Sq Ft
Est. Value
About This Home
This home is located at 3312 Maple St SW, Bondurant, IA 50035 and is currently estimated at $317,807, approximately $181 per square foot. 3312 Maple St SW is a home located in Polk County with nearby schools including Morris Elementary School, Anderson Elementary School, and Bondurant-Farrar Junior High.
Ownership History
Date
Name
Owned For
Owner Type
Purchase Details
Closed on
Feb 7, 2011
Sold by
Mittower Adam and Mittower Jennifer
Bought by
Mccaslin Louis B and Mccaslin Carol J
Current Estimated Value
Home Financials for this Owner
Home Financials are based on the most recent Mortgage that was taken out on this home.
Original Mortgage
$155,237
Outstanding Balance
$105,684
Interest Rate
4.75%
Mortgage Type
FHA
Estimated Equity
$212,123
Purchase Details
Closed on
Mar 7, 2008
Sold by
Hallbrooke Hammer Llc
Bought by
Mittower Adam and Mittower Jennifer
Home Financials for this Owner
Home Financials are based on the most recent Mortgage that was taken out on this home.
Original Mortgage
$147,720
Interest Rate
5.51%
Mortgage Type
VA
Purchase Details
Closed on
Jan 15, 2008
Sold by
Chateau At Bondurant Llc
Bought by
Hallbrooke Hammer Llc
Home Financials for this Owner
Home Financials are based on the most recent Mortgage that was taken out on this home.
Original Mortgage
$147,720
Interest Rate
5.51%
Mortgage Type
VA
Create a Home Valuation Report for This Property
The Home Valuation Report is an in-depth analysis detailing your home's value as well as a comparison with similar homes in the area
Home Values in the Area
Average Home Value in this Area
Purchase History
| Date | Buyer | Sale Price | Title Company |
|---|---|---|---|
| Mccaslin Louis B | $159,500 | None Available | |
| Mittower Adam | $157,500 | None Available | |
| Hallbrooke Hammer Llc | $14,500 | Itc |
Source: Public Records
Mortgage History
| Date | Status | Borrower | Loan Amount |
|---|---|---|---|
| Open | Mccaslin Louis B | $155,237 | |
| Previous Owner | Mittower Adam | $147,720 | |
| Previous Owner | Hallbrooke Hammer Llc | $122,009 |
Source: Public Records
Tax History Compared to Growth
Tax History
| Year | Tax Paid | Tax Assessment Tax Assessment Total Assessment is a certain percentage of the fair market value that is determined by local assessors to be the total taxable value of land and additions on the property. | Land | Improvement |
|---|---|---|---|---|
| 2025 | $4,522 | $289,300 | $53,700 | $235,600 |
| 2024 | $4,522 | $262,800 | $48,100 | $214,700 |
| 2023 | $4,550 | $262,800 | $48,100 | $214,700 |
| 2022 | $4,524 | $220,800 | $41,900 | $178,900 |
| 2021 | $4,780 | $220,800 | $41,900 | $178,900 |
| 2020 | $4,722 | $211,500 | $40,000 | $171,500 |
| 2019 | $4,564 | $211,500 | $40,000 | $171,500 |
| 2018 | $4,474 | $189,200 | $35,200 | $154,000 |
| 2017 | $3,952 | $189,200 | $35,200 | $154,000 |
| 2016 | $3,866 | $164,100 | $31,300 | $132,800 |
| 2015 | $3,866 | $164,100 | $31,300 | $132,800 |
| 2014 | $2,240 | $154,500 | $29,300 | $125,200 |
Source: Public Records
Map
Nearby Homes
- 3401 Maple St SW
- 817 33rd St SW
- 817 35th St SW
- 3504 Wolf Creek Rd SW
- 3214 Locust St SW
- 1013 10th Ave NW
- 944 Sunburst Ln
- 935 Breezewood Cir
- 1005 6th St NW
- 512 3rd Ave NW
- 612 12th Ave NW
- 605 12th Ave NW
- 1006 6th St NW
- 1909 16th Cir SE
- 1634 Prairie Cir
- 301 13th Ave NW
- 1605 2nd St NW
- 107 10th Ave SW
- 500 15th St SE
- 108 12th Ave SW
- 3308 Maple St SW
- 3316 Maple St SW
- 3307 Oak Dr SW
- 3309 Oak Dr SW
- 3305 Oak Dr SW
- 3304 Maple St SW
- 3400 Maple St SW
- 3401 Oak Dr SW
- 3313 Maple St SW
- 3309 Maple St SW
- 3317 Maple St SW
- 3305 Maple St SW
- 3300 Maple St SW
- 3303 Oak Dr SW
- 3403 Oak Dr SW
- 807 33rd St SW
- 3404 Maple St SW
- 3321 Maple St SW
- 3301 Maple St SW
- 3308 Poplar Dr SW