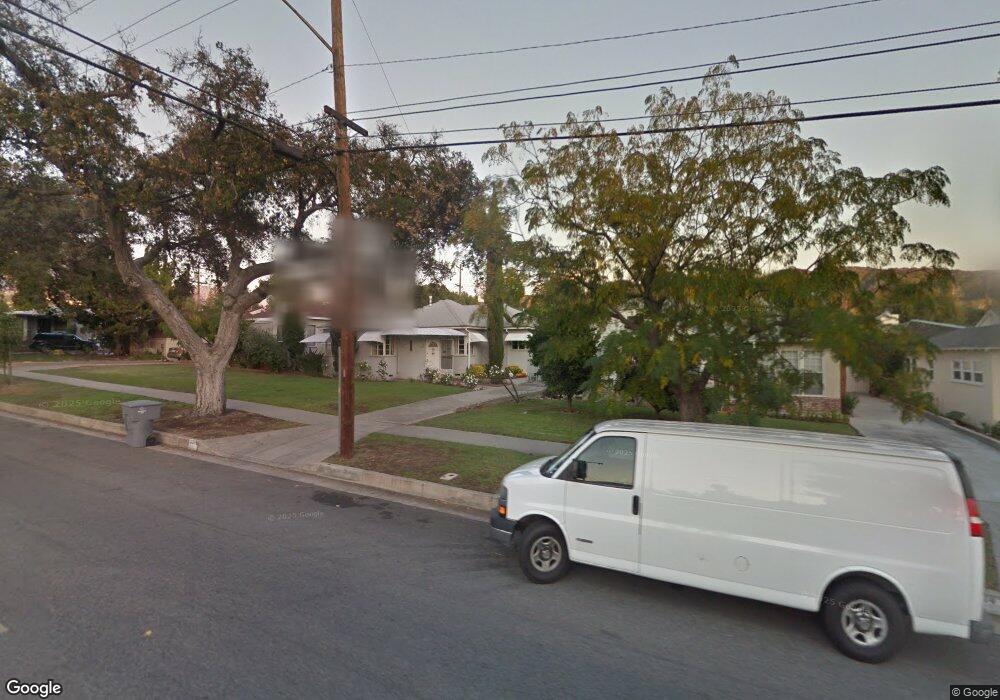
3316 N Verdugo Rd Glendale, CA 91208
Montecito Park NeighborhoodEstimated Value: $1,105,000 - $1,341,000
3
Beds
2
Baths
1,345
Sq Ft
$915/Sq Ft
Est. Value
About This Home
This home is located at 3316 N Verdugo Rd, Glendale, CA 91208 and is currently estimated at $1,230,514, approximately $914 per square foot. 3316 N Verdugo Rd is a home located in Los Angeles County with nearby schools including John C. Fremont Elementary School, Rosemont Middle School, and Crescenta Valley High School.
Ownership History
Date
Name
Owned For
Owner Type
Purchase Details
Closed on
May 14, 2004
Sold by
Roh Chong Hyun
Bought by
Roh Alice J
Current Estimated Value
Home Financials for this Owner
Home Financials are based on the most recent Mortgage that was taken out on this home.
Original Mortgage
$436,000
Outstanding Balance
$201,017
Interest Rate
5.37%
Mortgage Type
New Conventional
Estimated Equity
$1,029,497
Purchase Details
Closed on
Oct 23, 2002
Sold by
Johannesen Robert A
Bought by
Johannesen Robert A and Johannesen Delores R
Purchase Details
Closed on
Oct 14, 1997
Sold by
Johannesen Margaret H
Bought by
Johannesen Ralph C
Create a Home Valuation Report for This Property
The Home Valuation Report is an in-depth analysis detailing your home's value as well as a comparison with similar homes in the area
Home Values in the Area
Average Home Value in this Area
Purchase History
| Date | Buyer | Sale Price | Title Company |
|---|---|---|---|
| Roh Alice J | -- | Fidelity National Title Co | |
| Roh Alice J | $545,000 | Fidelity National Title Co | |
| Johannesen Robert A | -- | -- | |
| Johannesen Ralph C | -- | -- |
Source: Public Records
Mortgage History
| Date | Status | Borrower | Loan Amount |
|---|---|---|---|
| Open | Roh Alice J | $436,000 | |
| Closed | Roh Alice J | $54,500 |
Source: Public Records
Tax History Compared to Growth
Tax History
| Year | Tax Paid | Tax Assessment Tax Assessment Total Assessment is a certain percentage of the fair market value that is determined by local assessors to be the total taxable value of land and additions on the property. | Land | Improvement |
|---|---|---|---|---|
| 2025 | $8,628 | $774,858 | $619,894 | $154,964 |
| 2024 | $8,415 | $759,666 | $607,740 | $151,926 |
| 2023 | $8,223 | $744,772 | $595,824 | $148,948 |
| 2022 | $8,079 | $730,170 | $584,142 | $146,028 |
| 2021 | $7,940 | $715,854 | $572,689 | $143,165 |
| 2019 | $7,635 | $694,623 | $555,703 | $138,920 |
| 2018 | $7,466 | $681,004 | $544,807 | $136,197 |
| 2016 | $7,124 | $654,561 | $523,652 | $130,909 |
| 2015 | $6,977 | $644,730 | $515,787 | $128,943 |
| 2014 | $6,340 | $579,000 | $463,000 | $116,000 |
Source: Public Records
Map
Nearby Homes
- 3328 N Verdugo Rd
- 3120 N Verdugo Rd
- 3226 Menlo Dr
- 0 Bayberry Dr Unit 25567317
- 3351 Country Club Dr
- 3127 San Gabriel Ave
- 2940 N Verdugo Rd Unit 305
- 1605 Santa Rosa Ave
- 3417 Oakmont View Dr
- 1881 Alpha Rd Unit 8
- 1724 Sombra Dr
- 3323 Barnes Cir
- 2231 Montrose Ave Unit 2
- 1935 Alpha Rd Unit 112
- 1935 Alpha Rd Unit 337
- 1935 Alpha Rd Unit 310
- 2249 Montrose Ave Unit 7
- 1300 Daily Cir
- 182 Emburns Dr
- 192 Emburns Dr
- 3320 N Verdugo Rd
- 3314 N Verdugo Rd
- 3324 N Verdugo Rd
- 3310 N Verdugo Rd
- 3315 Castera Ave
- 3311 Castera Ave
- 3319 Castera Ave
- 3307 Castera Ave
- 1813 Glencoe Way
- 3323 Castera Ave
- 1809 Glencoe Way
- 1805 Glencoe Way
- 3305 Castera Ave
- 3327 Castera Ave
- 1801 Glencoe Way Unit A
- 1801 Glencoe Way
- 3301 Castera Ave
- 3331 Castera Ave
- 3335 Castera Ave
- 3323 N Verdugo Rd