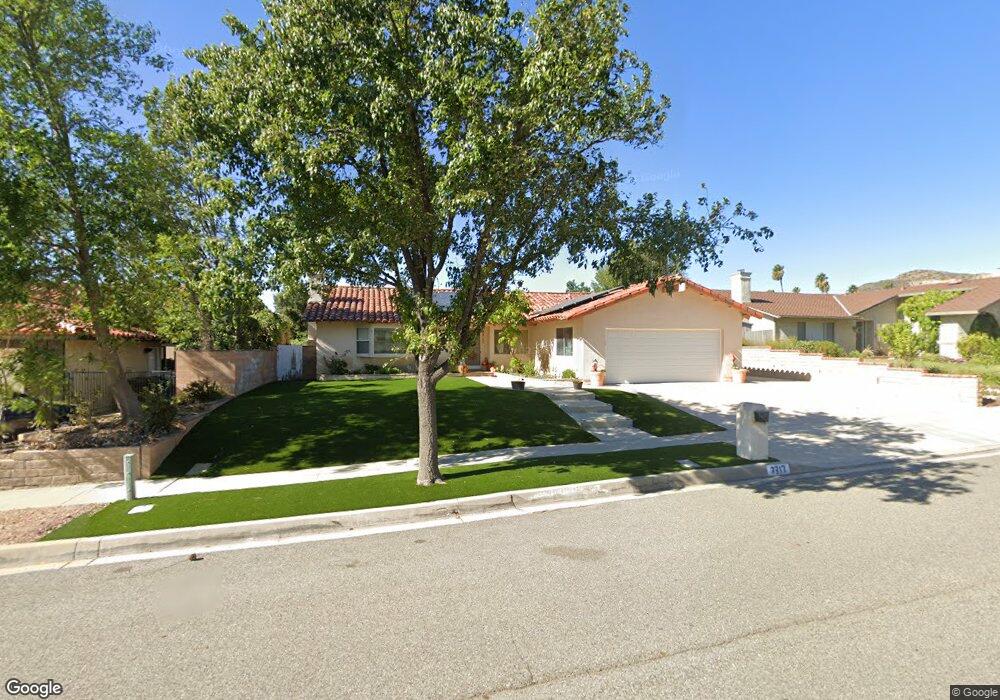
3317 Texas Ave Simi Valley, CA 93063
East Simi Valley NeighborhoodEstimated Value: $856,000 - $920,290
4
Beds
2
Baths
1,823
Sq Ft
$484/Sq Ft
Est. Value
About This Home
This home is located at 3317 Texas Ave, Simi Valley, CA 93063 and is currently estimated at $881,573, approximately $483 per square foot. 3317 Texas Ave is a home located in Ventura County with nearby schools including Big Springs Elementary School, Valley View Middle School, and Simi Valley High School.
Ownership History
Date
Name
Owned For
Owner Type
Purchase Details
Closed on
Sep 19, 2024
Sold by
Riley Steven P and Riley Karen L
Bought by
Steven And Karen Riley Family Trust and Riley
Current Estimated Value
Purchase Details
Closed on
Jan 14, 2009
Sold by
Owens Larry A and Owens Peggy A
Bought by
Riley Steven P and Riley Karen L
Home Financials for this Owner
Home Financials are based on the most recent Mortgage that was taken out on this home.
Original Mortgage
$308,000
Interest Rate
5.14%
Mortgage Type
Purchase Money Mortgage
Purchase Details
Closed on
Sep 13, 1995
Sold by
The Federal Home Loan Mtg Corp
Bought by
Thomason Timothy J and Thomason Theresa M
Home Financials for this Owner
Home Financials are based on the most recent Mortgage that was taken out on this home.
Original Mortgage
$145,200
Interest Rate
7.88%
Purchase Details
Closed on
Mar 23, 1995
Sold by
Countrywide Funding Corp and Ohngren John
Bought by
Countrywide Funding Corp
Purchase Details
Closed on
Feb 16, 1995
Sold by
Countrywide Funding Corp
Bought by
Federal Home Loan Mortgage Corporation
Create a Home Valuation Report for This Property
The Home Valuation Report is an in-depth analysis detailing your home's value as well as a comparison with similar homes in the area
Home Values in the Area
Average Home Value in this Area
Purchase History
| Date | Buyer | Sale Price | Title Company |
|---|---|---|---|
| Steven And Karen Riley Family Trust | -- | None Listed On Document | |
| Riley Steven P | $385,000 | Ticor Title Company | |
| Thomason Timothy J | $181,500 | Fidelity National Title Ins | |
| Countrywide Funding Corp | $181,505 | Chicago Title Co | |
| Federal Home Loan Mortgage Corporation | -- | Chicago Title Co |
Source: Public Records
Mortgage History
| Date | Status | Borrower | Loan Amount |
|---|---|---|---|
| Previous Owner | Riley Steven P | $308,000 | |
| Previous Owner | Thomason Timothy J | $145,200 |
Source: Public Records
Tax History
| Year | Tax Paid | Tax Assessment Tax Assessment Total Assessment is a certain percentage of the fair market value that is determined by local assessors to be the total taxable value of land and additions on the property. | Land | Improvement |
|---|---|---|---|---|
| 2025 | $6,902 | $573,032 | $286,518 | $286,514 |
| 2024 | $6,902 | $561,797 | $280,900 | $280,897 |
| 2023 | $6,491 | $550,782 | $275,392 | $275,390 |
| 2022 | $6,471 | $539,983 | $269,992 | $269,991 |
| 2021 | $6,428 | $529,396 | $264,698 | $264,698 |
| 2020 | $6,299 | $523,970 | $261,985 | $261,985 |
| 2019 | $6,013 | $513,698 | $256,849 | $256,849 |
| 2018 | $5,966 | $503,626 | $251,813 | $251,813 |
| 2017 | $5,836 | $493,752 | $246,876 | $246,876 |
| 2016 | $5,575 | $484,072 | $242,036 | $242,036 |
| 2015 | $5,461 | $476,802 | $238,401 | $238,401 |
| 2014 | $5,387 | $467,464 | $233,732 | $233,732 |
Source: Public Records
Map
Nearby Homes
- 4679 Summit Ave
- 4683 Summit Ave
- 4776 El Prado St
- 4920 Corral St
- 5019 Corral St
- 3239 Hamlin Ave
- 0 American Cut Off (Apn 649-0-020-010) Rd Unit SR25060657
- 28 Chivo
- 62 Las Lljas Canyon Rd
- 125 Fern Dr
- 25 Chivo
- 26 Chivo
- 27 Chivo
- 4699 Summit Ave
- 3008 Cisco Ct
- 4691 Summit Ave
- 4741 Westwood St
- 4687 Summit Ave
- 5474 Sunlight St
- 4591 Hempstead St
Your Personal Tour Guide
Ask me questions while you tour the home.