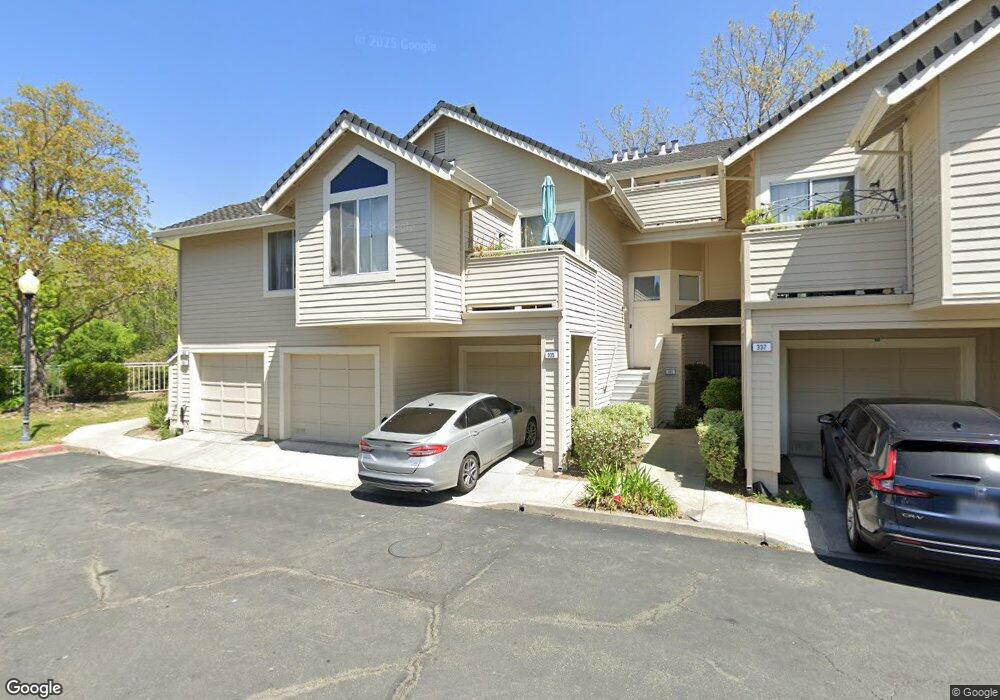
333 Lagoon Cir Hercules, CA 94547
Estimated Value: $478,000 - $564,000
3
Beds
2
Baths
1,274
Sq Ft
$405/Sq Ft
Est. Value
About This Home
This home is located at 333 Lagoon Cir, Hercules, CA 94547 and is currently estimated at $516,261, approximately $405 per square foot. 333 Lagoon Cir is a home located in Contra Costa County with nearby schools including Hanna Ranch Elementary School, Hercules Middle School, and Hercules High School.
Ownership History
Date
Name
Owned For
Owner Type
Purchase Details
Closed on
Sep 3, 2004
Sold by
Dowell Angela M and Dowell Angelia M
Bought by
Dowell Angela M
Current Estimated Value
Home Financials for this Owner
Home Financials are based on the most recent Mortgage that was taken out on this home.
Original Mortgage
$245,000
Outstanding Balance
$108,174
Interest Rate
4.27%
Mortgage Type
Negative Amortization
Estimated Equity
$408,087
Purchase Details
Closed on
Feb 24, 1998
Sold by
Weyerhaeuser Mtg Company
Bought by
Dowell Angelica M
Home Financials for this Owner
Home Financials are based on the most recent Mortgage that was taken out on this home.
Original Mortgage
$122,500
Interest Rate
6.9%
Mortgage Type
Purchase Money Mortgage
Purchase Details
Closed on
Aug 28, 1997
Sold by
Watson David J and Watson Veronn Jacobs
Bought by
Federal National Mtg Associates
Purchase Details
Closed on
Aug 12, 1997
Sold by
Watson David J and Watson Veronn Jacobs
Bought by
Weyerhauser Mtg Company
Create a Home Valuation Report for This Property
The Home Valuation Report is an in-depth analysis detailing your home's value as well as a comparison with similar homes in the area
Home Values in the Area
Average Home Value in this Area
Purchase History
| Date | Buyer | Sale Price | Title Company |
|---|---|---|---|
| Dowell Angela M | -- | North American Title | |
| Dowell Angelica M | $129,000 | North American Title Co | |
| Federal National Mtg Associates | $131,491 | First American Title Ins Co | |
| Weyerhauser Mtg Company | $129,500 | -- |
Source: Public Records
Mortgage History
| Date | Status | Borrower | Loan Amount |
|---|---|---|---|
| Open | Dowell Angela M | $245,000 | |
| Closed | Dowell Angelica M | $122,500 |
Source: Public Records
Tax History
| Year | Tax Paid | Tax Assessment Tax Assessment Total Assessment is a certain percentage of the fair market value that is determined by local assessors to be the total taxable value of land and additions on the property. | Land | Improvement |
|---|---|---|---|---|
| 2025 | $4,160 | $205,954 | $49,883 | $156,071 |
| 2024 | $4,022 | $201,916 | $48,905 | $153,011 |
| 2023 | $3,963 | $197,958 | $47,947 | $150,011 |
| 2022 | $3,917 | $194,077 | $47,007 | $147,070 |
| 2021 | $3,909 | $190,273 | $46,086 | $144,187 |
| 2019 | $3,741 | $184,631 | $44,720 | $139,911 |
| 2018 | $3,650 | $181,012 | $43,844 | $137,168 |
| 2017 | $3,604 | $177,464 | $42,985 | $134,479 |
| 2016 | $3,416 | $173,986 | $42,143 | $131,843 |
| 2015 | $3,419 | $171,373 | $41,510 | $129,863 |
| 2014 | $3,434 | $168,017 | $40,697 | $127,320 |
Source: Public Records
Map
Nearby Homes
- 301 Boatswain Ct
- 103 Tuscany Ct
- 256 Napoli Ct Unit 256
- 139 Tuscany Ct Unit 139
- 161 Seaway Ct
- 248 Carson St
- 134 Caprice Cir
- 118 Cottonwood Ct
- 211 Meadowlark Way
- 2555 Arroyo Ave
- 2620 Shady Draw
- 2654 Tamalpais Dr Unit 38
- 720 Seacliff Ct
- 1723 Pheasant Dr
- 2662 Carmelita Way
- 405 Weymouth
- 938 Sandy Cove Dr
- 120 Bonita Ct
- 704 Windsor Unit 704
- 103 Obsidian Way
- 337 Lagoon Cir Unit 337
- 335 Lagoon Cir
- 343 Lagoon Cir
- 339 Lagoon Cir
- 341 Lagoon Cir Unit 1
- 341 Lagoon Cir Unit 341
- 345 Lagoon Cir Unit 345
- 347 Lagoon Cir
- 347 Lagoon Cir Unit 347
- 327 Lagoon Cir Unit 1
- 329 Lagoon Cir
- 325 Lagoon Cir
- 331 Lagoon Cir Unit 331
- 355 Sextant Ct
- 353 Sextant Ct
- 351 Sextant Ct
- 361 Sextant Ct
- 359 Sextant Ct
- 357 Sextant Ct
- 349 Sextant Ct
Your Personal Tour Guide
Ask me questions while you tour the home.