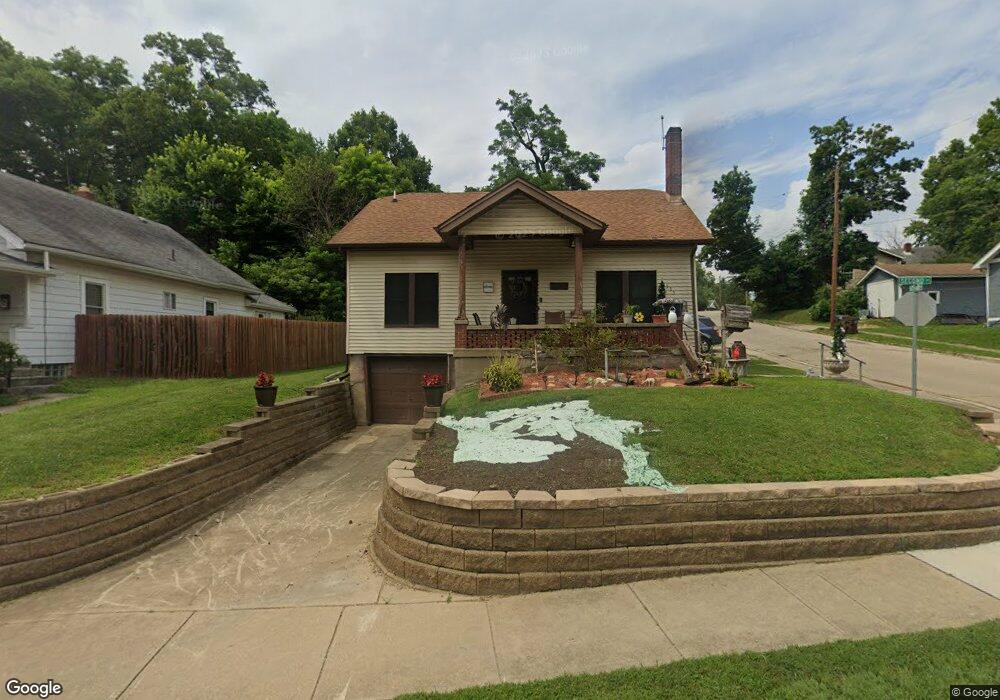
335 E 2nd St Franklin, OH 45005
Estimated Value: $123,000 - $195,000
3
Beds
1
Bath
1,234
Sq Ft
$133/Sq Ft
Est. Value
About This Home
This home is located at 335 E 2nd St, Franklin, OH 45005 and is currently estimated at $164,544, approximately $133 per square foot. 335 E 2nd St is a home located in Warren County with nearby schools including Franklin High School.
Ownership History
Date
Name
Owned For
Owner Type
Purchase Details
Closed on
May 11, 1999
Sold by
Smith Anthony R
Bought by
Kemp Richard P
Current Estimated Value
Home Financials for this Owner
Home Financials are based on the most recent Mortgage that was taken out on this home.
Original Mortgage
$68,493
Outstanding Balance
$19,944
Interest Rate
10%
Mortgage Type
New Conventional
Estimated Equity
$144,600
Purchase Details
Closed on
Mar 20, 1998
Sold by
Jones Stephen L
Bought by
Smith Anthony R and Smith Sondra K
Home Financials for this Owner
Home Financials are based on the most recent Mortgage that was taken out on this home.
Original Mortgage
$50,000
Interest Rate
7.14%
Mortgage Type
New Conventional
Purchase Details
Closed on
Nov 26, 1991
Sold by
Rose Rose and Rose Len
Bought by
Jones Jones and Jones Stephen L
Purchase Details
Closed on
Nov 14, 1983
Sold by
Steigerwald Steigerwald and Steigerwald Harry S
Bought by
Rose Rose and Rose Len
Create a Home Valuation Report for This Property
The Home Valuation Report is an in-depth analysis detailing your home's value as well as a comparison with similar homes in the area
Home Values in the Area
Average Home Value in this Area
Purchase History
| Date | Buyer | Sale Price | Title Company |
|---|---|---|---|
| Kemp Richard P | $79,000 | -- | |
| Smith Anthony R | $50,000 | -- | |
| Jones Jones | $46,900 | -- | |
| Rose Rose | $30,000 | -- |
Source: Public Records
Mortgage History
| Date | Status | Borrower | Loan Amount |
|---|---|---|---|
| Open | Kemp Richard P | $68,493 | |
| Previous Owner | Smith Anthony R | $50,000 |
Source: Public Records
Tax History
| Year | Tax Paid | Tax Assessment Tax Assessment Total Assessment is a certain percentage of the fair market value that is determined by local assessors to be the total taxable value of land and additions on the property. | Land | Improvement |
|---|---|---|---|---|
| 2025 | $2,138 | $42,690 | $8,920 | $33,770 |
| 2024 | $2,138 | $42,690 | $8,920 | $33,770 |
| 2023 | $1,737 | $32,648 | $5,054 | $27,594 |
| 2022 | $1,679 | $32,648 | $5,054 | $27,594 |
| 2021 | $1,592 | $32,648 | $5,054 | $27,594 |
| 2020 | $1,433 | $25,914 | $4,015 | $21,900 |
| 2019 | $1,303 | $25,914 | $4,015 | $21,900 |
| 2018 | $1,285 | $25,914 | $4,015 | $21,900 |
| 2017 | $1,348 | $24,479 | $3,854 | $20,626 |
| 2016 | $1,374 | $24,479 | $3,854 | $20,626 |
| 2015 | $1,460 | $24,479 | $3,854 | $20,626 |
| 2014 | $1,409 | $24,480 | $3,850 | $20,630 |
| 2013 | $1,195 | $28,320 | $4,460 | $23,860 |
Source: Public Records
Map
Nearby Homes
- 551 E 2nd St
- 202 E 2nd St
- 11 Highridge Ct
- 21 Skokiaan Dr
- 0 Victoria Dr Unit 942075
- 0 Victoria Dr Unit 1852824
- 5 S River St
- 747 David Blvd
- 760 David Blvd
- 388 Thomas Dr
- 45 W 3rd St
- 0 E 4th St
- 409 Millard Dr
- 205 Oxford Rd
- 165 Elaine Dr
- 228 Bridge St
- 527 S Main St
- 309 Oxford Rd
- 1200 Riley Blvd
- 410 Park Ave
Your Personal Tour Guide
Ask me questions while you tour the home.