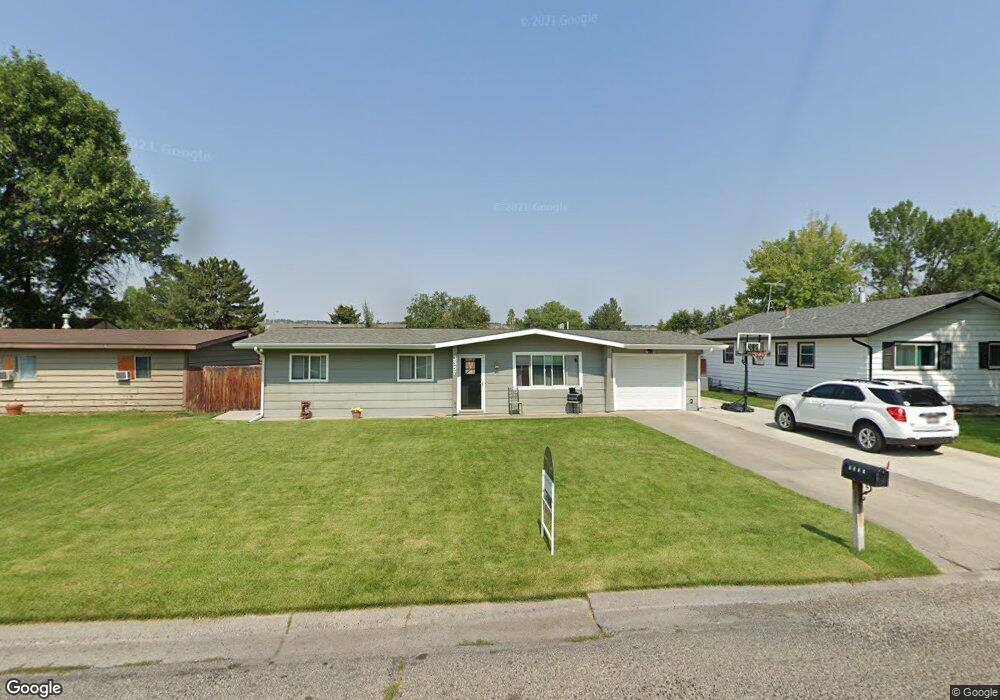
3357 Winchell Ln Billings, MT 59102
West End NeighborhoodEstimated Value: $287,000 - $319,000
3
Beds
2
Baths
960
Sq Ft
$318/Sq Ft
Est. Value
About This Home
This home is located at 3357 Winchell Ln, Billings, MT 59102 and is currently estimated at $305,241, approximately $317 per square foot. 3357 Winchell Ln is a home located in Yellowstone County with nearby schools including Meadowlark School, Will James Junior High School, and Billings West High School.
Ownership History
Date
Name
Owned For
Owner Type
Purchase Details
Closed on
Sep 3, 2021
Sold by
Elaine Wipperling Kendal
Bought by
Stockman Bank
Current Estimated Value
Home Financials for this Owner
Home Financials are based on the most recent Mortgage that was taken out on this home.
Original Mortgage
$239,580
Outstanding Balance
$217,675
Interest Rate
2.7%
Mortgage Type
FHA
Estimated Equity
$87,566
Purchase Details
Closed on
Apr 29, 2011
Sold by
Lachenmaier Dustin R
Bought by
Barthel Lane R
Home Financials for this Owner
Home Financials are based on the most recent Mortgage that was taken out on this home.
Original Mortgage
$131,089
Interest Rate
4.75%
Mortgage Type
FHA
Purchase Details
Closed on
Oct 7, 2009
Sold by
Hansen Shannon
Bought by
Lachenmaier Dustin R
Home Financials for this Owner
Home Financials are based on the most recent Mortgage that was taken out on this home.
Original Mortgage
$125,500
Interest Rate
5.02%
Mortgage Type
New Conventional
Create a Home Valuation Report for This Property
The Home Valuation Report is an in-depth analysis detailing your home's value as well as a comparison with similar homes in the area
Home Values in the Area
Average Home Value in this Area
Purchase History
| Date | Buyer | Sale Price | Title Company |
|---|---|---|---|
| Stockman Bank | -- | Stewart Title | |
| Wipperling Kendal Elaine | -- | Stewart Title Company | |
| Barthel Lane R | -- | None Available | |
| Lachenmaier Dustin R | -- | St |
Source: Public Records
Mortgage History
| Date | Status | Borrower | Loan Amount |
|---|---|---|---|
| Open | Wipperling Kendal Elaine | $239,580 | |
| Previous Owner | Barthel Lane R | $131,089 | |
| Previous Owner | Barthel Lane R | $3,500 | |
| Previous Owner | Lachenmaier Dustin R | $125,500 |
Source: Public Records
Tax History Compared to Growth
Tax History
| Year | Tax Paid | Tax Assessment Tax Assessment Total Assessment is a certain percentage of the fair market value that is determined by local assessors to be the total taxable value of land and additions on the property. | Land | Improvement |
|---|---|---|---|---|
| 2025 | $2,518 | $285,900 | $48,699 | $237,201 |
| 2024 | $2,518 | $259,600 | $47,544 | $212,056 |
| 2023 | $2,523 | $259,600 | $47,544 | $212,056 |
| 2022 | $2,043 | $182,500 | $0 | $0 |
| 2021 | $1,926 | $180,400 | $0 | $0 |
| 2020 | $1,957 | $175,000 | $0 | $0 |
| 2019 | $1,869 | $175,000 | $0 | $0 |
| 2018 | $1,803 | $165,600 | $0 | $0 |
| 2017 | $1,751 | $165,600 | $0 | $0 |
| 2016 | $1,588 | $151,100 | $0 | $0 |
| 2015 | $1,552 | $151,100 | $0 | $0 |
| 2014 | $1,370 | $70,278 | $0 | $0 |
Source: Public Records
Map
Nearby Homes
- 3334 Winchell Ln
- 371 W Daffodil Dr
- 3142 Saint Johns Ave
- 3136 Saint Johns Ave
- 3220 Lynn Ave
- 3231 Central Ave
- 3517 Central Ave
- 3515-3517 Central
- 909 Maywood Dr
- 915 Maywood Dr
- 1125 30th St W
- 3291 Banff Ave
- 1524 Golden Blvd
- 2900 Manhattan Dr
- 2930 Lynn Ave
- 3297 Banff Ave Unit 10
- 3641 Glantz Dr
- 1606 Golden Blvd
- 13 S 38th St W
- 3087 Hunters Ridge Loop
- 3359 Winchell Ln
- 3345 Winchell Ln
- 3326 Ravalli Place
- 3365 Winchell Ln
- 3329 Winchell Ln
- 3317 Winchell Ln
- 3358 Winchell Ln
- 3352 Winchell Ln
- 3330 Ravalli Place
- 3364 Winchell Ln
- 3320 Ravalli Place
- 3346 Winchell Ln
- 3401 Winchell Ln
- 3311 Winchell Ln
- 3370 Winchell Ln
- 3334 Ravalli Place
- 3338 Ravalli Place
- 3307 Winchell Ln
- 3340 Winchell Ln
- 3314 Broadwater Ave