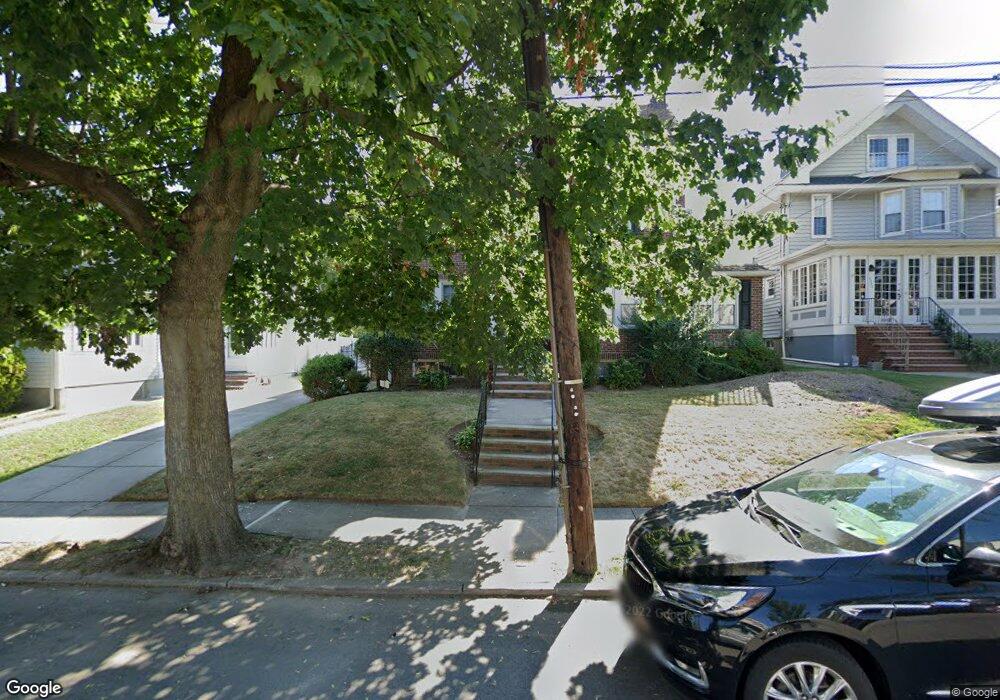
3361 167th St Flushing, NY 11358
Murray Hill-Broadway NeighborhoodEstimated Value: $1,314,000 - $1,511,000
Studio
--
Bath
2,490
Sq Ft
$570/Sq Ft
Est. Value
About This Home
This home is located at 3361 167th St, Flushing, NY 11358 and is currently estimated at $1,419,614, approximately $570 per square foot. 3361 167th St is a home located in Queens County with nearby schools including P.S. 32 - State Street, I.S. 25 Adrien Block, and Francis Lewis High School.
Ownership History
Date
Name
Owned For
Owner Type
Purchase Details
Closed on
Mar 7, 2025
Sold by
Gao Fei and Gao Jean Z
Bought by
Fei Gao As Trustee Under Gao Zhang Trust and Gao Zhang Trust
Current Estimated Value
Purchase Details
Closed on
Feb 16, 2022
Sold by
Petsas Sofia
Bought by
Gao Fei and Gao Jean Z
Home Financials for this Owner
Home Financials are based on the most recent Mortgage that was taken out on this home.
Original Mortgage
$810,000
Interest Rate
3.69%
Mortgage Type
Purchase Money Mortgage
Purchase Details
Closed on
Aug 10, 2012
Sold by
Theodosopoulos George and Theodosopoulos Sofia
Bought by
Petsas Sofia
Purchase Details
Closed on
Apr 5, 1994
Sold by
Derleth Donald W
Bought by
Theodosopoulos George and Theodosopoulos Sofia
Home Financials for this Owner
Home Financials are based on the most recent Mortgage that was taken out on this home.
Original Mortgage
$182,000
Interest Rate
7.7%
Mortgage Type
Purchase Money Mortgage
Create a Home Valuation Report for This Property
The Home Valuation Report is an in-depth analysis detailing your home's value as well as a comparison with similar homes in the area
Home Values in the Area
Average Home Value in this Area
Purchase History
We collect this data history from publicly available records. To have your information removed, we recommend requesting removal directly through your county’s website.
| Date | Buyer | Sale Price | Title Company |
|---|---|---|---|
| Fei Gao As Trustee Under Gao Zhang Trust | -- | -- | |
| Fei Gao As Trustee Under Gao Zhang Trust | -- | -- | |
| Gao Fei | $1,350,000 | -- | |
| Gao Fei | $1,350,000 | -- | |
| Petsas Sofia | -- | -- | |
| Petsas Sofia | -- | -- | |
| Petsas Sofia | -- | -- | |
| Theodosopoulos George | $282,000 | -- | |
| Theodosopoulos George | $282,000 | -- |
Source: Public Records
Mortgage History
We collect this data history from publicly available records. To have your information removed, we recommend requesting removal directly through your county’s website.
| Date | Status | Borrower | Loan Amount |
|---|---|---|---|
| Previous Owner | Gao Fei | $810,000 | |
| Previous Owner | Theodosopoulos George | $182,000 |
Source: Public Records
Tax History
| Year | Tax Paid | Tax Assessment Tax Assessment Total Assessment is a certain percentage of the fair market value that is determined by local assessors to be the total taxable value of land and additions on the property. | Land | Improvement |
|---|---|---|---|---|
| 2026 | $11,866 | $62,624 | $15,857 | $46,767 |
| 2025 | $11,195 | $59,081 | $17,595 | $41,486 |
| 2024 | $11,195 | $55,738 | $15,960 | $39,778 |
| 2023 | $11,195 | $55,738 | $15,586 | $40,152 |
| 2022 | $11,043 | $80,100 | $23,640 | $56,460 |
| 2021 | $10,983 | $73,440 | $23,640 | $49,800 |
| 2020 | $10,185 | $70,800 | $23,640 | $47,160 |
| 2019 | $9,716 | $78,000 | $23,640 | $54,360 |
| 2018 | $9,468 | $46,448 | $16,591 | $29,857 |
| 2017 | $11,447 | $46,098 | $17,531 | $28,567 |
| 2016 | $8,384 | $46,098 | $17,531 | $28,567 |
| 2015 | $5,025 | $41,028 | $18,817 | $22,211 |
| 2014 | $5,025 | $38,707 | $21,298 | $17,409 |
Source: Public Records
Map
Nearby Homes
- 166-15 35th Ave
- 3315 167th St
- 33-40 170th St
- 35-19 165th St
- 166-15 33rd Ave
- 3369 164th St
- 35-20 165th St
- 33-81 164th St
- 35-62 168th St
- 3221 168th St
- 164-04 33rd Ave
- 35-63 168th St
- 32-35 164th St
- 166-07 33rd Ave
- 167-10 Crocheron Ave Unit 6C
- 167-10 Crocheron Ave Unit 1F
- 167-10 Crocheron Ave Unit 4D
- 33-34 172nd St
- 16904 Crocheron Ave
- 17203 35th Ave
Your Personal Tour Guide
Ask me questions while you tour the home.