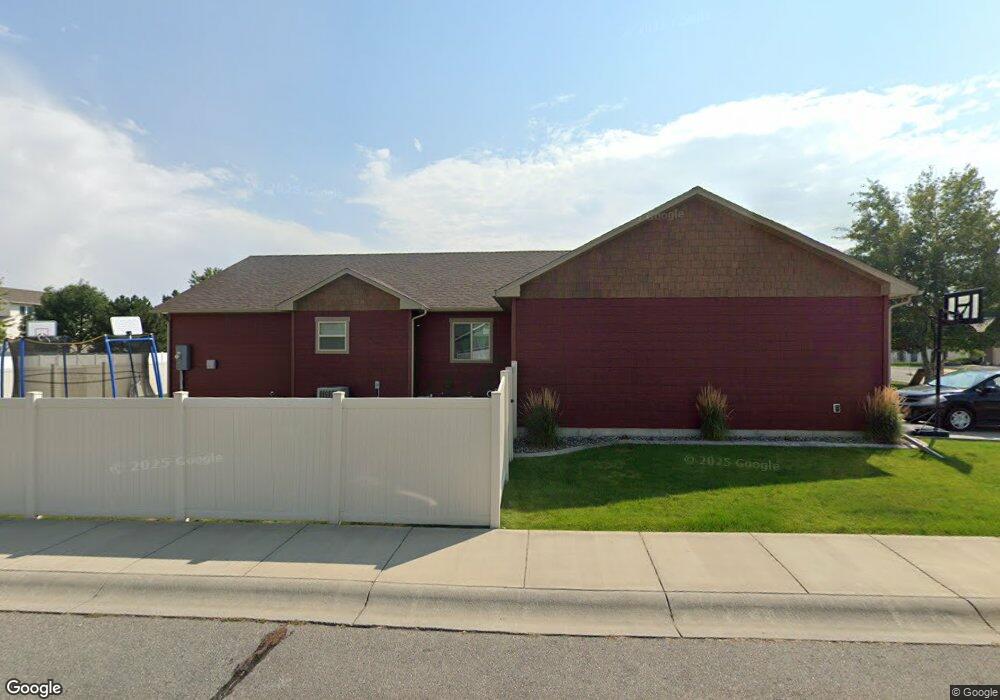
337 Future Cir Billings, MT 59102
West End NeighborhoodEstimated Value: $492,876 - $558,000
5
Beds
3
Baths
1,771
Sq Ft
$288/Sq Ft
Est. Value
About This Home
This home is located at 337 Future Cir, Billings, MT 59102 and is currently estimated at $510,469, approximately $288 per square foot. 337 Future Cir is a home located in Yellowstone County with nearby schools including Big Sky Elementary School, Ben Steele Middle School, and Billings West High School.
Ownership History
Date
Name
Owned For
Owner Type
Purchase Details
Closed on
Aug 31, 2015
Sold by
Bedson Matthew D and Bedson Tina M
Bought by
Decock Karl D and Decock Jasmine M
Current Estimated Value
Home Financials for this Owner
Home Financials are based on the most recent Mortgage that was taken out on this home.
Original Mortgage
$223,000
Outstanding Balance
$175,152
Interest Rate
3.91%
Mortgage Type
New Conventional
Estimated Equity
$335,317
Purchase Details
Closed on
Jul 30, 2009
Sold by
Home Builders Association Of Billings Mo
Bought by
Benson Matthew D and Benson Tina M
Home Financials for this Owner
Home Financials are based on the most recent Mortgage that was taken out on this home.
Original Mortgage
$227,900
Interest Rate
5.31%
Mortgage Type
Purchase Money Mortgage
Purchase Details
Closed on
Jun 29, 2006
Sold by
Mj Construction Inc
Bought by
Henkel Selma O
Create a Home Valuation Report for This Property
The Home Valuation Report is an in-depth analysis detailing your home's value as well as a comparison with similar homes in the area
Home Values in the Area
Average Home Value in this Area
Purchase History
| Date | Buyer | Sale Price | Title Company |
|---|---|---|---|
| Decock Karl D | -- | Chicago Title | |
| Benson Matthew D | -- | None Available | |
| Henkel Selma O | -- | None Available |
Source: Public Records
Mortgage History
| Date | Status | Borrower | Loan Amount |
|---|---|---|---|
| Open | Decock Karl D | $223,000 | |
| Previous Owner | Benson Matthew D | $227,900 |
Source: Public Records
Tax History
| Year | Tax Paid | Tax Assessment Tax Assessment Total Assessment is a certain percentage of the fair market value that is determined by local assessors to be the total taxable value of land and additions on the property. | Land | Improvement |
|---|---|---|---|---|
| 2025 | $4,659 | $491,400 | $87,245 | $404,155 |
| 2024 | $4,659 | $461,100 | $91,091 | $370,009 |
| 2023 | $4,615 | $461,100 | $91,091 | $370,009 |
| 2022 | $3,109 | $329,300 | $0 | $0 |
| 2021 | $3,560 | $329,300 | $0 | $0 |
| 2020 | $3,937 | $344,200 | $0 | $0 |
| 2019 | $3,765 | $344,200 | $0 | $0 |
| 2018 | $3,848 | $346,700 | $0 | $0 |
| 2017 | $3,743 | $346,700 | $0 | $0 |
| 2016 | $3,440 | $328,700 | $0 | $0 |
| 2015 | $3,451 | $328,700 | $0 | $0 |
| 2014 | $3,207 | $161,438 | $0 | $0 |
Source: Public Records
Map
Nearby Homes
- 370 Delta Cir
- 3121 New Hope Dr
- 3121 New Hope Dr Unit 9
- 3175 Solar Blvd Unit 14
- 499 Greenspring Place
- 207 Boston Hill Rd
- 3285 Canyon Dr
- 3294 Windmill Cir
- 2930 Lynn Ave
- 3214 Lynn Ave
- 14 Bonanza Dr
- 3220 Lynn Ave
- 3203 Lynn Ave
- 3136 Saint Johns Ave
- 15 Mountain Side Cir
- 98 Cache Dr
- 260 Wind Cave Cir
- 3385 Granger Ave S Unit 24
- 3385 Granger Ave S Unit 24, 27
- 3385 Granger Ave S Unit 27
Your Personal Tour Guide
Ask me questions while you tour the home.