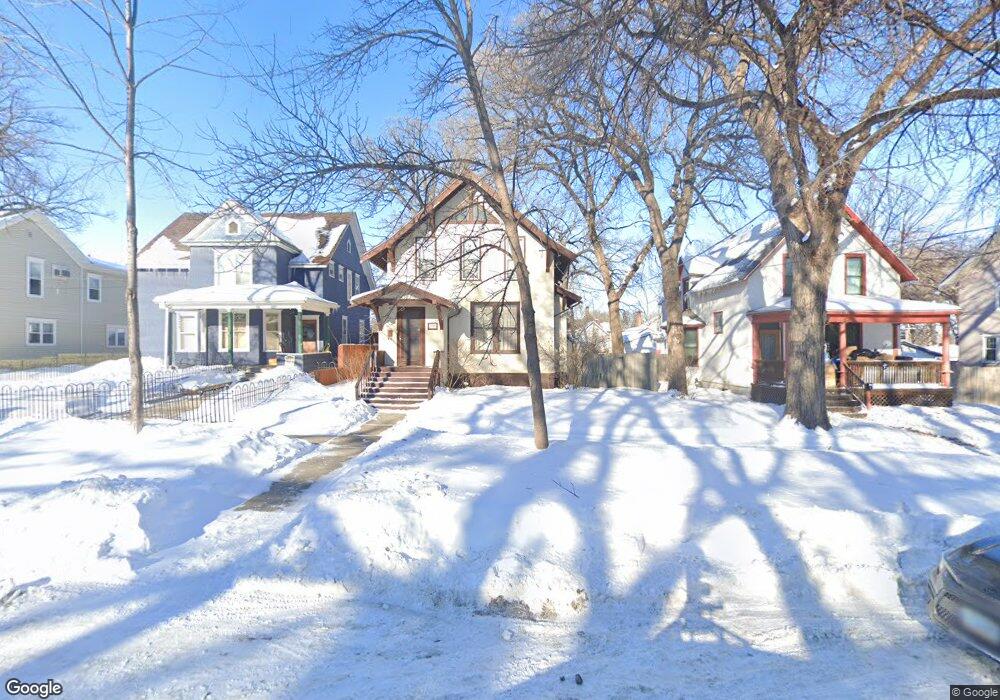
339 9th Ave S Fargo, ND 58103
Hawthorne NeighborhoodEstimated Value: $289,000 - $333,000
3
Beds
2
Baths
2,779
Sq Ft
$113/Sq Ft
Est. Value
About This Home
This home is located at 339 9th Ave S, Fargo, ND 58103 and is currently estimated at $313,538, approximately $112 per square foot. 339 9th Ave S is a home located in Cass County with nearby schools including Clara Barton Elementary School, Ben Franklin Middle School, and South High School.
Ownership History
Date
Name
Owned For
Owner Type
Purchase Details
Closed on
Dec 12, 2016
Sold by
Bakken Dale Allen and Bakken Dale
Bought by
Graunke Christopher
Current Estimated Value
Home Financials for this Owner
Home Financials are based on the most recent Mortgage that was taken out on this home.
Original Mortgage
$159,120
Outstanding Balance
$128,288
Interest Rate
3.47%
Mortgage Type
New Conventional
Estimated Equity
$185,250
Purchase Details
Closed on
Mar 22, 2013
Sold by
Arguello Bakken Cielito
Bought by
Bakken Dale Allen
Create a Home Valuation Report for This Property
The Home Valuation Report is an in-depth analysis detailing your home's value as well as a comparison with similar homes in the area
Home Values in the Area
Average Home Value in this Area
Purchase History
| Date | Buyer | Sale Price | Title Company |
|---|---|---|---|
| Graunke Christopher | $198,900 | Title Co | |
| Bakken Dale Allen | -- | None Available |
Source: Public Records
Mortgage History
| Date | Status | Borrower | Loan Amount |
|---|---|---|---|
| Open | Graunke Christopher | $159,120 |
Source: Public Records
Tax History Compared to Growth
Tax History
| Year | Tax Paid | Tax Assessment Tax Assessment Total Assessment is a certain percentage of the fair market value that is determined by local assessors to be the total taxable value of land and additions on the property. | Land | Improvement |
|---|---|---|---|---|
| 2024 | $3,655 | $134,450 | $20,050 | $114,400 |
| 2023 | $3,433 | $126,850 | $20,050 | $106,800 |
| 2022 | $3,176 | $115,300 | $20,050 | $95,250 |
| 2021 | $2,972 | $109,800 | $20,050 | $89,750 |
| 2020 | $2,952 | $109,800 | $20,050 | $89,750 |
| 2019 | $2,673 | $101,550 | $11,900 | $89,650 |
| 2018 | $2,638 | $101,550 | $11,900 | $89,650 |
| 2017 | $2,533 | $98,600 | $11,900 | $86,700 |
| 2016 | $2,256 | $95,750 | $11,900 | $83,850 |
| 2015 | $2,147 | $85,400 | $8,150 | $77,250 |
| 2014 | $2,001 | $77,650 | $8,150 | $69,500 |
| 2013 | $2,003 | $77,650 | $8,150 | $69,500 |
Source: Public Records
Map
Nearby Homes