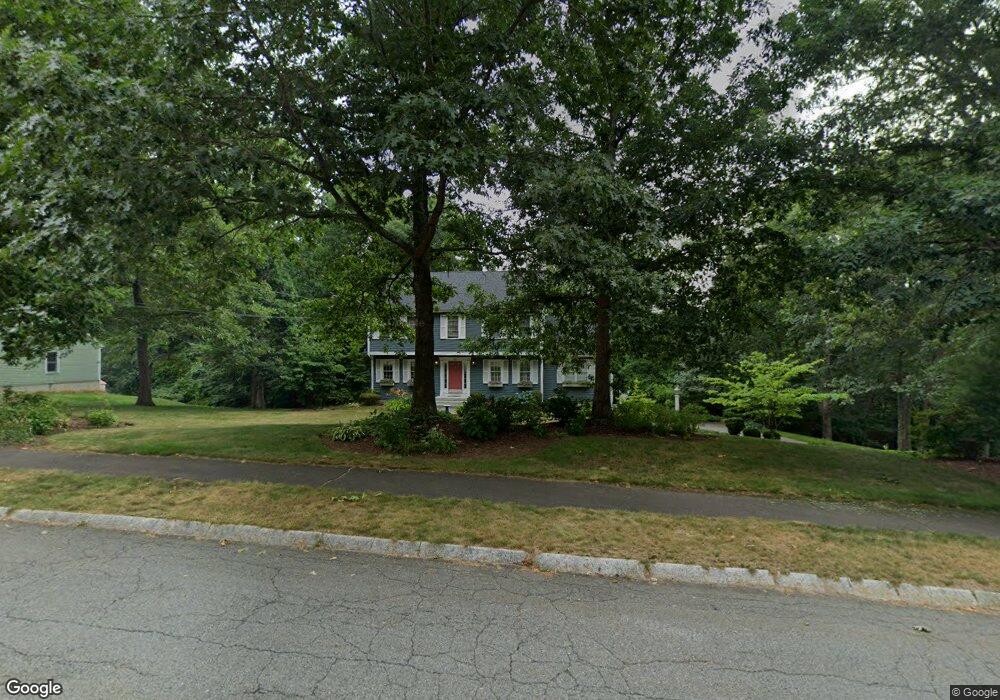
34 Briar Dr Milford, MA 01757
Estimated Value: $741,000 - $834,000
4
Beds
3
Baths
2,280
Sq Ft
$343/Sq Ft
Est. Value
About This Home
This home is located at 34 Briar Dr, Milford, MA 01757 and is currently estimated at $781,336, approximately $342 per square foot. 34 Briar Dr is a home located in Worcester County with nearby schools including Milford High School.
Ownership History
Date
Name
Owned For
Owner Type
Purchase Details
Closed on
Sep 29, 1995
Sold by
Ryniejski Halina
Bought by
Pinette Stephen and Pinette Lisa
Current Estimated Value
Home Financials for this Owner
Home Financials are based on the most recent Mortgage that was taken out on this home.
Original Mortgage
$164,800
Interest Rate
7.89%
Mortgage Type
Purchase Money Mortgage
Purchase Details
Closed on
Nov 16, 1993
Sold by
Lodge Corp
Bought by
Ryniejski Halina
Create a Home Valuation Report for This Property
The Home Valuation Report is an in-depth analysis detailing your home's value as well as a comparison with similar homes in the area
Home Values in the Area
Average Home Value in this Area
Purchase History
| Date | Buyer | Sale Price | Title Company |
|---|---|---|---|
| Pinette Stephen | $206,000 | -- | |
| Ryniejski Halina | $224,800 | -- |
Source: Public Records
Mortgage History
| Date | Status | Borrower | Loan Amount |
|---|---|---|---|
| Open | Ryniejski Halina | $129,000 | |
| Closed | Ryniejski Halina | $146,000 | |
| Closed | Ryniejski Halina | $166,500 | |
| Closed | Ryniejski Halina | $164,800 |
Source: Public Records
Tax History Compared to Growth
Tax History
| Year | Tax Paid | Tax Assessment Tax Assessment Total Assessment is a certain percentage of the fair market value that is determined by local assessors to be the total taxable value of land and additions on the property. | Land | Improvement |
|---|---|---|---|---|
| 2025 | $8,099 | $632,700 | $226,800 | $405,900 |
| 2024 | $8,009 | $602,600 | $218,100 | $384,500 |
| 2023 | $7,443 | $515,100 | $181,100 | $334,000 |
| 2022 | $7,016 | $455,900 | $165,800 | $290,100 |
| 2021 | $6,724 | $420,800 | $165,800 | $255,000 |
| 2020 | $6,643 | $416,200 | $165,800 | $250,400 |
| 2019 | $6,518 | $394,100 | $165,800 | $228,300 |
| 2018 | $6,455 | $389,800 | $161,500 | $228,300 |
| 2017 | $6,187 | $368,500 | $161,500 | $207,000 |
| 2016 | $6,083 | $354,100 | $161,500 | $192,600 |
| 2015 | $6,079 | $346,400 | $161,500 | $184,900 |
Source: Public Records
Map
Nearby Homes