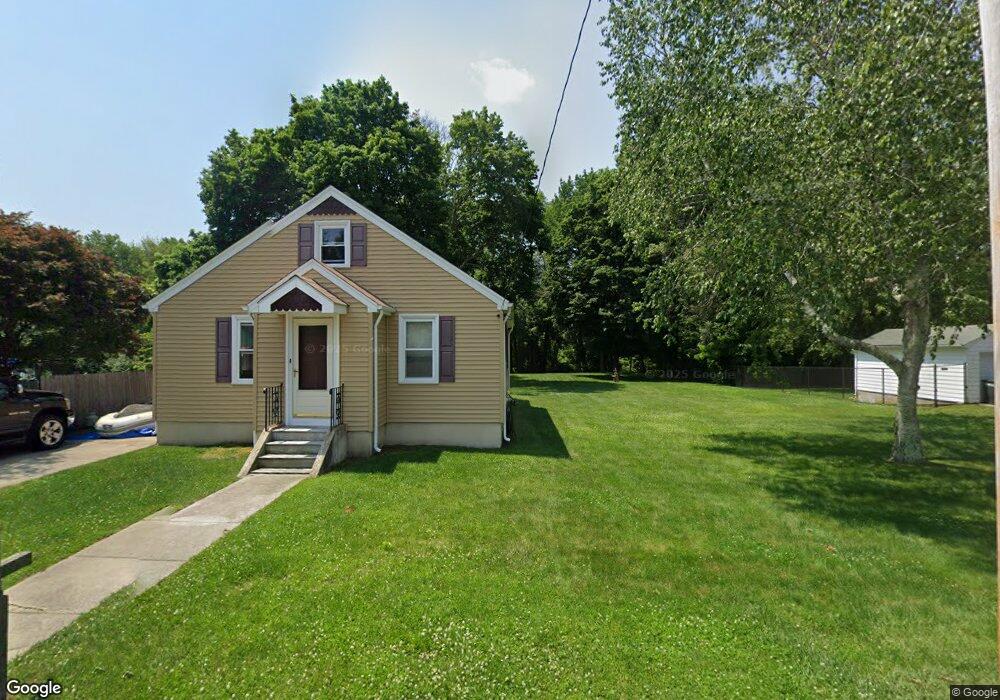
34 Delway Rd Cranston, RI 02910
Eden Park NeighborhoodEstimated Value: $363,000 - $390,000
2
Beds
1
Bath
864
Sq Ft
$436/Sq Ft
Est. Value
About This Home
This home is located at 34 Delway Rd, Cranston, RI 02910 and is currently estimated at $376,330, approximately $435 per square foot. 34 Delway Rd is a home located in Providence County with nearby schools including Eden Park Elementary School, Park View Middle School, and Cranston High School East.
Ownership History
Date
Name
Owned For
Owner Type
Purchase Details
Closed on
Feb 28, 1994
Sold by
Hammer Hildegard M
Bought by
Brothers Barry E
Current Estimated Value
Home Financials for this Owner
Home Financials are based on the most recent Mortgage that was taken out on this home.
Original Mortgage
$86,500
Interest Rate
6.96%
Create a Home Valuation Report for This Property
The Home Valuation Report is an in-depth analysis detailing your home's value as well as a comparison with similar homes in the area
Home Values in the Area
Average Home Value in this Area
Purchase History
| Date | Buyer | Sale Price | Title Company |
|---|---|---|---|
| Brothers Barry E | $92,000 | -- |
Source: Public Records
Mortgage History
| Date | Status | Borrower | Loan Amount |
|---|---|---|---|
| Open | Brothers Barry E | $100,000 | |
| Closed | Brothers Barry E | $105,000 | |
| Closed | Brothers Barry E | $86,500 |
Source: Public Records
Tax History Compared to Growth
Tax History
| Year | Tax Paid | Tax Assessment Tax Assessment Total Assessment is a certain percentage of the fair market value that is determined by local assessors to be the total taxable value of land and additions on the property. | Land | Improvement |
|---|---|---|---|---|
| 2025 | $4,221 | $304,100 | $104,300 | $199,800 |
| 2024 | $4,139 | $304,100 | $104,300 | $199,800 |
| 2023 | $4,018 | $212,600 | $72,000 | $140,600 |
| 2022 | $3,935 | $212,600 | $72,000 | $140,600 |
| 2021 | $3,827 | $212,600 | $72,000 | $140,600 |
| 2020 | $3,656 | $176,000 | $68,400 | $107,600 |
| 2019 | $3,656 | $176,000 | $68,400 | $107,600 |
| 2018 | $3,571 | $176,000 | $68,400 | $107,600 |
| 2017 | $3,173 | $138,300 | $50,400 | $87,900 |
| 2016 | $3,105 | $138,300 | $50,400 | $87,900 |
| 2015 | $3,105 | $138,300 | $50,400 | $87,900 |
| 2014 | $3,056 | $133,800 | $50,400 | $83,400 |
Source: Public Records
Map
Nearby Homes
- 10 Sheffield Rd
- 28 Hybrid Dr
- 446 Budlong Rd
- 132 Fordson Ave Unit 12
- 113 Fordson Ave
- 105 Fordson Ave
- 26 Keith Ave
- 140 Concord Ave
- 141 Glen Ridge Rd
- 0 Rutland St
- 12 Stevens Rd
- 18 Glenwood Ave
- 34 Keller Ave
- 69 W View Ave
- 638 Pontiac Ave
- 111 Belgium St
- 36 Blackamore Ave
- 99 Salem Ave
- 38 Brettonwoods Dr
- 46 Roslyn Ave