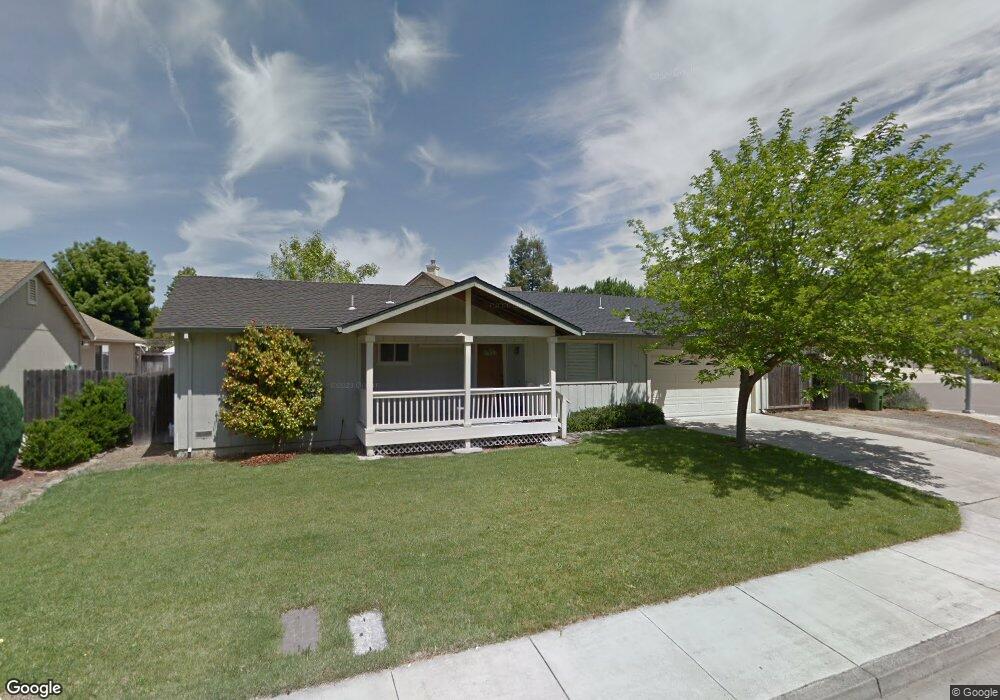
340 Cornell St Windsor, CA 95492
Estimated Value: $629,938 - $701,000
3
Beds
2
Baths
1,096
Sq Ft
$608/Sq Ft
Est. Value
About This Home
This home is located at 340 Cornell St, Windsor, CA 95492 and is currently estimated at $666,735, approximately $608 per square foot. 340 Cornell St is a home located in Sonoma County with nearby schools including Mattie Washburn Elementary School, Brooks Elementary School, and Windsor Middle School.
Ownership History
Date
Name
Owned For
Owner Type
Purchase Details
Closed on
Sep 6, 2007
Sold by
Leach Lorilee and The Valencia Family Titleholdi
Bought by
Wattles Victoria L and Wattles Theodore M
Current Estimated Value
Home Financials for this Owner
Home Financials are based on the most recent Mortgage that was taken out on this home.
Original Mortgage
$230,000
Outstanding Balance
$146,365
Interest Rate
6.67%
Mortgage Type
Purchase Money Mortgage
Estimated Equity
$520,370
Create a Home Valuation Report for This Property
The Home Valuation Report is an in-depth analysis detailing your home's value as well as a comparison with similar homes in the area
Home Values in the Area
Average Home Value in this Area
Purchase History
| Date | Buyer | Sale Price | Title Company |
|---|---|---|---|
| Wattles Victoria L | -- | Chicago Title Company |
Source: Public Records
Mortgage History
| Date | Status | Borrower | Loan Amount |
|---|---|---|---|
| Open | Wattles Victoria L | $230,000 |
Source: Public Records
Tax History
| Year | Tax Paid | Tax Assessment Tax Assessment Total Assessment is a certain percentage of the fair market value that is determined by local assessors to be the total taxable value of land and additions on the property. | Land | Improvement |
|---|---|---|---|---|
| 2025 | $5,346 | $445,329 | $171,309 | $274,020 |
| 2024 | $5,346 | $436,598 | $167,950 | $268,648 |
| 2023 | $5,346 | $428,038 | $164,657 | $263,381 |
| 2022 | $5,157 | $419,646 | $161,429 | $258,217 |
| 2021 | $5,057 | $411,418 | $158,264 | $253,154 |
| 2020 | $5,170 | $407,201 | $156,642 | $250,559 |
| 2019 | $5,166 | $399,218 | $153,571 | $245,647 |
| 2018 | $5,093 | $391,391 | $150,560 | $240,831 |
| 2017 | $5,044 | $383,717 | $147,608 | $236,109 |
| 2016 | $4,751 | $376,194 | $144,714 | $231,480 |
| 2015 | $4,621 | $370,544 | $142,541 | $228,003 |
| 2014 | $4,004 | $316,000 | $122,000 | $194,000 |
Source: Public Records
Map
Nearby Homes
- 333 Cornell Stree
- 172 Cornell St
- 140 Billington Ln
- 156 Cornell St
- 203 Cockrobin Ave
- 6516 Hwy
- 8148 D St
- 8156 D St
- 125 Anish Way
- 123 Dartmouth Way
- 8147 Willow St
- 345 Wilson Ln
- 127 Pleasant Ave
- 8145 Willow St
- 719 Hackberry Ct
- 1038 Capewood Ln
- 8169 Willow St
- 1138 Broadleaf Ln
- 7225 16th Hole Dr
- 13 Darcy Dr
Your Personal Tour Guide
Ask me questions while you tour the home.