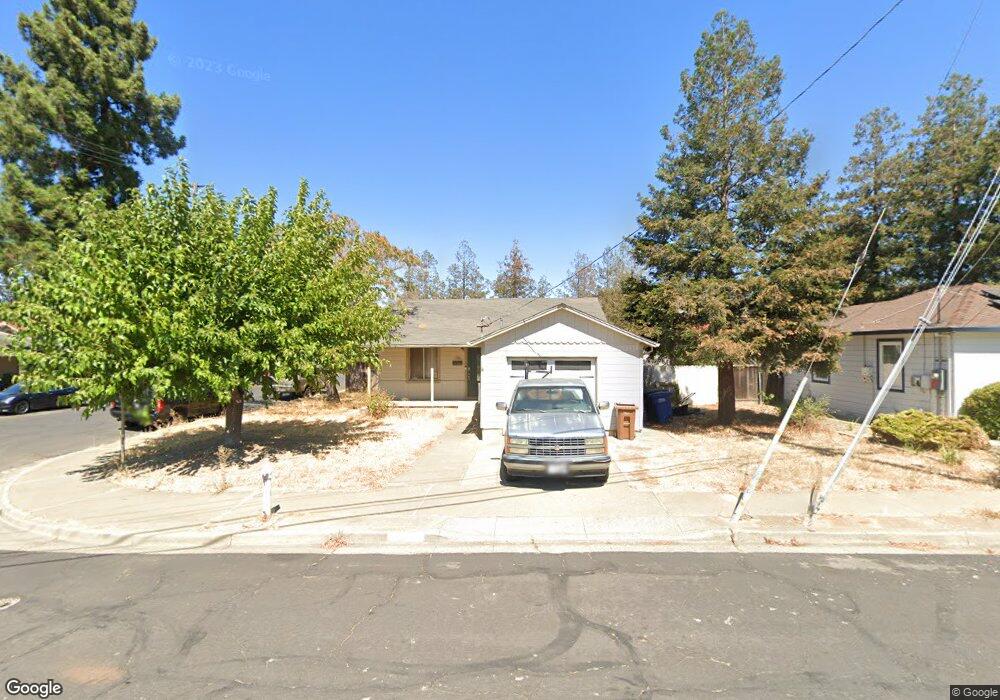
3401 Del Chiaro Way Concord, CA 94518
Crawford Village NeighborhoodEstimated Value: $525,000 - $631,679
2
Beds
1
Bath
900
Sq Ft
$635/Sq Ft
Est. Value
About This Home
This home is located at 3401 Del Chiaro Way, Concord, CA 94518 and is currently estimated at $571,670, approximately $635 per square foot. 3401 Del Chiaro Way is a home located in Contra Costa County with nearby schools including El Monte Elementary School, El Dorado Middle School, and Concord High School.
Ownership History
Date
Name
Owned For
Owner Type
Purchase Details
Closed on
Feb 24, 2025
Sold by
Mcdonagh Jessica Lyn
Bought by
Mcdonagh Michael Thomas
Current Estimated Value
Purchase Details
Closed on
Jun 22, 2018
Sold by
Mcdonagh Tom and Mcdonagh Patricia Katherine
Bought by
Mcdonagh Michael Thomas and Mcdonagh Jessica Lyn
Home Financials for this Owner
Home Financials are based on the most recent Mortgage that was taken out on this home.
Original Mortgage
$304,950
Interest Rate
4.5%
Mortgage Type
New Conventional
Purchase Details
Closed on
Aug 19, 2014
Sold by
Redding John and Redding Michelle A
Bought by
The Thomas Mcdonagh & Patricia Katherine
Purchase Details
Closed on
May 3, 1995
Sold by
Bologni Fabio and Bologni Marie
Bought by
Redding John and Redding Michelle A
Home Financials for this Owner
Home Financials are based on the most recent Mortgage that was taken out on this home.
Original Mortgage
$80,000
Interest Rate
8.46%
Mortgage Type
Seller Take Back
Create a Home Valuation Report for This Property
The Home Valuation Report is an in-depth analysis detailing your home's value as well as a comparison with similar homes in the area
Home Values in the Area
Average Home Value in this Area
Purchase History
| Date | Buyer | Sale Price | Title Company |
|---|---|---|---|
| Mcdonagh Michael Thomas | -- | None Listed On Document | |
| Mcdonagh Michael Thomas | $321,000 | Chicago Title Company | |
| The Thomas Mcdonagh & Patricia Katherine | $295,000 | Chicago Title Company | |
| Redding John | $120,000 | Old Republic Title Company |
Source: Public Records
Mortgage History
| Date | Status | Borrower | Loan Amount |
|---|---|---|---|
| Previous Owner | Mcdonagh Michael Thomas | $304,950 | |
| Previous Owner | Redding John | $80,000 |
Source: Public Records
Tax History Compared to Growth
Tax History
| Year | Tax Paid | Tax Assessment Tax Assessment Total Assessment is a certain percentage of the fair market value that is determined by local assessors to be the total taxable value of land and additions on the property. | Land | Improvement |
|---|---|---|---|---|
| 2025 | $6,588 | $521,122 | $364,104 | $157,018 |
| 2024 | $6,459 | $510,905 | $356,965 | $153,940 |
| 2023 | $6,459 | $500,888 | $349,966 | $150,922 |
| 2022 | $6,369 | $491,067 | $343,104 | $147,963 |
| 2021 | $6,209 | $481,439 | $336,377 | $145,062 |
| 2019 | $4,397 | $317,827 | $229,698 | $88,129 |
| 2018 | $4,224 | $311,596 | $225,195 | $86,401 |
| 2017 | $4,076 | $305,487 | $220,780 | $84,707 |
| 2016 | $3,949 | $299,498 | $216,451 | $83,047 |
| 2015 | $3,889 | $295,000 | $213,200 | $81,800 |
| 2014 | $2,400 | $164,412 | $112,353 | $52,059 |
Source: Public Records
Map
Nearby Homes
- 1455 Grove Way
- 3479 Rose Ct
- 1715 Copperleaf Ct
- 1230 Hale Dr
- 3115 Marvelle Ln
- 3641 Clayton Rd Unit 34
- 1736 6th St
- 1198 Quail Ct
- 3021 The Alameda
- 3901 Clayton Rd Unit 57
- 2947 Concord Blvd
- 3622 Delancey Ln
- 2941 Crawford St
- 2860 Laguna St
- 3810 Lornell Ct
- 3905 Clayton Rd Unit 37
- 3539 Wren Ave
- 3449 Wren Ave
- 1848 Parkside Dr
- 3715 Liscome Way
- 3403 Del Chiaro Way
- 3405 Del Chiaro Way
- 100 Fabian Way
- 3400 Del Chiaro Way
- 110 Fabian Way
- 3407 Del Chiaro Way
- 3392 Clayton Rd
- 120 Fabian Way
- 3404 Del Chiaro Way
- 131 Fabian Way
- 3409 Del Chiaro Way
- 130 Fabian Way
- 108 Kerman Dr
- 141 Fabian Way
- 1480 Grove Way
- 1474 Grove Way
- 3411 Del Chiaro Way
- 140 Fabian Way
- 3350 Clayton Rd
- 112 Kerman Dr