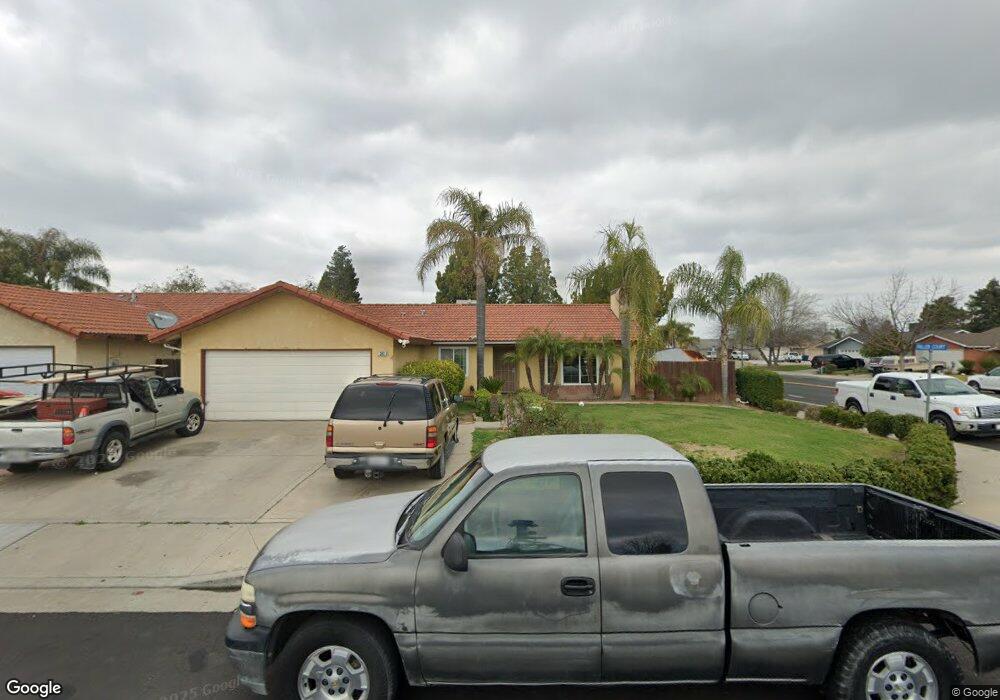
341 Faller Ct Sanger, CA 93657
Estimated Value: $344,305 - $356,000
3
Beds
2
Baths
1,275
Sq Ft
$276/Sq Ft
Est. Value
About This Home
This home is located at 341 Faller Ct, Sanger, CA 93657 and is currently estimated at $351,435, approximately $275 per square foot. 341 Faller Ct is a home located in Fresno County with nearby schools including Wilson Elementary School, Washington Academic Middle School, and Sanger High School.
Ownership History
Date
Name
Owned For
Owner Type
Purchase Details
Closed on
Jul 23, 2025
Sold by
Arredondo Antonio De Jesus
Bought by
Arredondo Marlenn and Hernandez Marlenn
Current Estimated Value
Purchase Details
Closed on
Mar 26, 2022
Sold by
Arredondo and Rafaela
Bought by
Arredondo Marlenne and Dearredondo Antonio De
Purchase Details
Closed on
Sep 21, 2003
Sold by
Gill Sardool Singh
Bought by
Arredondo Jesus and Arredondo Rafaela
Home Financials for this Owner
Home Financials are based on the most recent Mortgage that was taken out on this home.
Original Mortgage
$120,536
Interest Rate
5.98%
Mortgage Type
FHA
Purchase Details
Closed on
Apr 22, 1994
Sold by
Gill Sardool Singh and Gill Sardool
Bought by
Gill Sardool Singh
Home Financials for this Owner
Home Financials are based on the most recent Mortgage that was taken out on this home.
Original Mortgage
$70,200
Interest Rate
7.28%
Create a Home Valuation Report for This Property
The Home Valuation Report is an in-depth analysis detailing your home's value as well as a comparison with similar homes in the area
Home Values in the Area
Average Home Value in this Area
Purchase History
| Date | Buyer | Sale Price | Title Company |
|---|---|---|---|
| Arredondo Marlenn | -- | None Listed On Document | |
| Arredondo Marlenne | -- | None Listed On Document | |
| Arredondo Jesus | $148,000 | Chicago Title Company | |
| Gill Sardool Singh | -- | World Title Co |
Source: Public Records
Mortgage History
| Date | Status | Borrower | Loan Amount |
|---|---|---|---|
| Previous Owner | Arredondo Jesus | $120,536 | |
| Previous Owner | Gill Sardool Singh | $70,200 |
Source: Public Records
Tax History
| Year | Tax Paid | Tax Assessment Tax Assessment Total Assessment is a certain percentage of the fair market value that is determined by local assessors to be the total taxable value of land and additions on the property. | Land | Improvement |
|---|---|---|---|---|
| 2025 | $4,101 | $323,668 | $58,366 | $265,302 |
| 2023 | $3,839 | $311,100 | $56,100 | $255,000 |
| 2022 | $2,468 | $198,271 | $40,185 | $158,086 |
| 2021 | $2,294 | $182,000 | $37,400 | $144,600 |
| 2020 | $2,229 | $180,300 | $37,100 | $143,200 |
| 2019 | $2,185 | $176,800 | $36,400 | $140,400 |
| 2018 | $2,095 | $173,400 | $35,700 | $137,700 |
| 2017 | $2,059 | $170,000 | $35,000 | $135,000 |
| 2016 | $1,802 | $155,000 | $30,000 | $125,000 |
| 2015 | $1,781 | $149,600 | $30,200 | $119,400 |
| 2014 | $1,680 | $140,100 | $28,300 | $111,800 |
Source: Public Records
Map
Nearby Homes
Your Personal Tour Guide
Ask me questions while you tour the home.