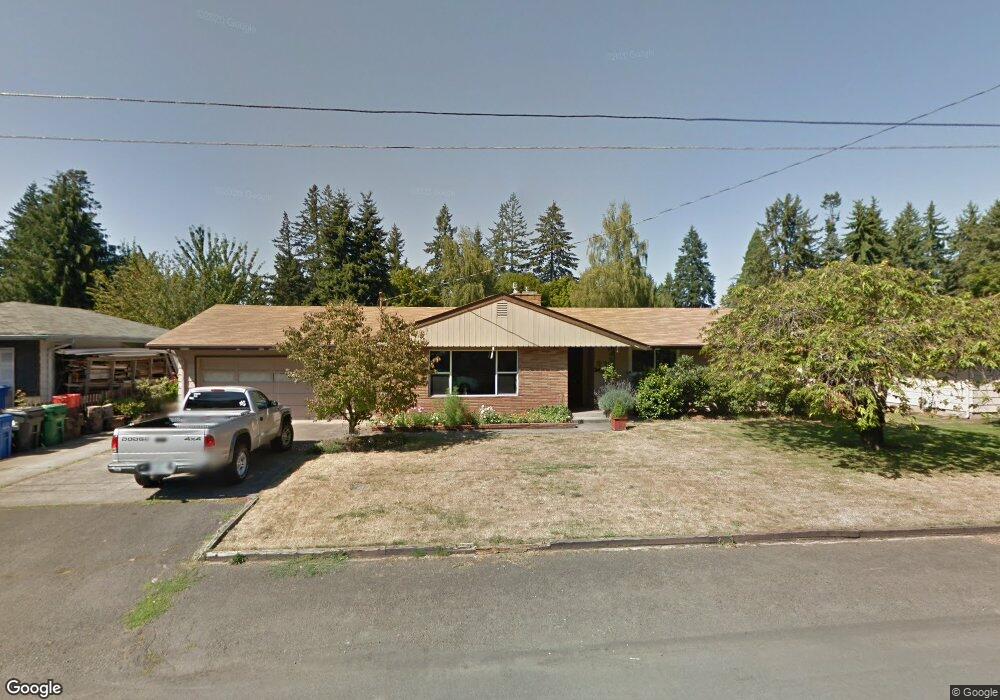
341 Hardy Ave Eugene, OR 97404
River Road NeighborhoodEstimated Value: $453,000 - $552,000
3
Beds
2
Baths
1,758
Sq Ft
$280/Sq Ft
Est. Value
About This Home
This home is located at 341 Hardy Ave, Eugene, OR 97404 and is currently estimated at $491,818, approximately $279 per square foot. 341 Hardy Ave is a home located in Lane County with nearby schools including River Road/El Camino del Río Elementary School, Kelly Middle School, and North Eugene High School.
Ownership History
Date
Name
Owned For
Owner Type
Purchase Details
Closed on
Aug 29, 2016
Sold by
Wagner Linda M
Bought by
Curran Brandon R and Curran Lacey R
Current Estimated Value
Home Financials for this Owner
Home Financials are based on the most recent Mortgage that was taken out on this home.
Original Mortgage
$275,000
Outstanding Balance
$218,465
Interest Rate
3.43%
Mortgage Type
VA
Estimated Equity
$273,353
Purchase Details
Closed on
Jan 19, 2012
Sold by
Nicolato Kelli L and Wagner Linda M
Bought by
Wagner Linda M
Home Financials for this Owner
Home Financials are based on the most recent Mortgage that was taken out on this home.
Original Mortgage
$208,000
Interest Rate
3.93%
Mortgage Type
New Conventional
Purchase Details
Closed on
Apr 16, 2009
Sold by
Wheeler Christine C
Bought by
Nicolato Kelli L and Wagner Linda M
Home Financials for this Owner
Home Financials are based on the most recent Mortgage that was taken out on this home.
Original Mortgage
$208,078
Interest Rate
4.8%
Mortgage Type
FHA
Create a Home Valuation Report for This Property
The Home Valuation Report is an in-depth analysis detailing your home's value as well as a comparison with similar homes in the area
Home Values in the Area
Average Home Value in this Area
Purchase History
| Date | Buyer | Sale Price | Title Company |
|---|---|---|---|
| Curran Brandon R | $275,000 | First American Title | |
| Wagner Linda M | -- | Cascade Title Company | |
| Nicolato Kelli L | $255,000 | Western Title |
Source: Public Records
Mortgage History
| Date | Status | Borrower | Loan Amount |
|---|---|---|---|
| Open | Curran Brandon R | $275,000 | |
| Previous Owner | Wagner Linda M | $208,000 | |
| Previous Owner | Nicolato Kelli L | $208,078 |
Source: Public Records
Tax History
| Year | Tax Paid | Tax Assessment Tax Assessment Total Assessment is a certain percentage of the fair market value that is determined by local assessors to be the total taxable value of land and additions on the property. | Land | Improvement |
|---|---|---|---|---|
| 2025 | $3,892 | $294,831 | -- | -- |
| 2024 | $3,850 | $286,244 | -- | -- |
| 2023 | $3,850 | $277,907 | $0 | $0 |
| 2022 | $3,621 | $269,813 | $0 | $0 |
| 2021 | $3,368 | $261,955 | $0 | $0 |
| 2020 | $3,331 | $254,326 | $0 | $0 |
| 2019 | $3,175 | $246,919 | $0 | $0 |
| 2018 | $3,710 | $232,746 | $0 | $0 |
| 2017 | $3,476 | $232,746 | $0 | $0 |
| 2016 | $3,306 | $225,967 | $0 | $0 |
| 2015 | $3,216 | $219,385 | $0 | $0 |
| 2014 | $3,188 | $212,995 | $0 | $0 |
Source: Public Records
Map
Nearby Homes
- 820 Park Terrace
- 780 Cherry Ave
- 734 Filbert Ave
- 157 Hansen Ln
- 32 Marion Ln
- 805 River Rd
- 0 River Rd Unit 634143722
- 882 Jackies Ln
- 172 Oakleigh Ln Unit 513
- 172 Oakleigh Ln Unit 221
- 144 Briarcliff Dr
- 1010 Horn Ln
- 111 Holeman Ave
- 1295 Betty Ln
- 1633 Zoe Ave
- 1010 N Park Ave
- 104 Holeman Ave
- 1035 Madera St
- 168 150 N Cleveland St
- 168 N Cleveland St
Your Personal Tour Guide
Ask me questions while you tour the home.