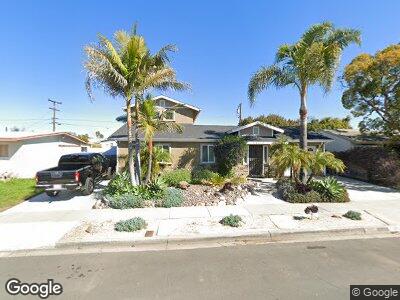
3416 Idlewild Way San Diego, CA 92117
Bay Ho NeighborhoodEstimated Value: $1,067,000 - $1,626,928
4
Beds
3
Baths
2,538
Sq Ft
$516/Sq Ft
Est. Value
About This Home
This home is located at 3416 Idlewild Way, San Diego, CA 92117 and is currently estimated at $1,310,232, approximately $516 per square foot. 3416 Idlewild Way is a home located in San Diego County with nearby schools including Cadman Elementary School, Marston Middle School, and Clairemont High School.
Ownership History
Date
Name
Owned For
Owner Type
Purchase Details
Closed on
Apr 4, 2011
Sold by
Dela Cruz Mario E and De La Cruz Christine
Bought by
Delacruz Mario E and Delacruz Christine
Current Estimated Value
Home Financials for this Owner
Home Financials are based on the most recent Mortgage that was taken out on this home.
Original Mortgage
$350,000
Interest Rate
4.74%
Mortgage Type
New Conventional
Purchase Details
Closed on
Dec 6, 1999
Sold by
Buchanan Miyoko Trust 03-03-92 and Lawrence
Bought by
Delacruz Mario and Delacruz Christine
Home Financials for this Owner
Home Financials are based on the most recent Mortgage that was taken out on this home.
Original Mortgage
$169,990
Interest Rate
7.84%
Mortgage Type
FHA
Create a Home Valuation Report for This Property
The Home Valuation Report is an in-depth analysis detailing your home's value as well as a comparison with similar homes in the area
Home Values in the Area
Average Home Value in this Area
Purchase History
| Date | Buyer | Sale Price | Title Company |
|---|---|---|---|
| Delacruz Mario E | -- | None Available | |
| Delacruz Mario | $175,000 | Southland Title |
Source: Public Records
Mortgage History
| Date | Status | Borrower | Loan Amount |
|---|---|---|---|
| Open | Dela Cruz Mario E | $435,000 | |
| Closed | Delacruz Mario E | $417,000 | |
| Closed | Delacruz Mario | $350,000 | |
| Closed | Delacruz Mario | $340,000 | |
| Closed | Delacruz Mario | $30,000 | |
| Closed | Delacruz Mario | $237,000 | |
| Closed | Delacruz Mario | $166,954 | |
| Closed | Delacruz Mario | $167,517 | |
| Previous Owner | Delacruz Mario | $169,990 |
Source: Public Records
Tax History Compared to Growth
Tax History
| Year | Tax Paid | Tax Assessment Tax Assessment Total Assessment is a certain percentage of the fair market value that is determined by local assessors to be the total taxable value of land and additions on the property. | Land | Improvement |
|---|---|---|---|---|
| 2024 | $5,717 | $469,689 | $104,253 | $365,436 |
| 2023 | $5,589 | $460,480 | $102,209 | $358,271 |
| 2022 | $5,439 | $451,452 | $100,205 | $351,247 |
| 2021 | $5,400 | $442,601 | $98,241 | $344,360 |
| 2020 | $5,334 | $438,064 | $97,234 | $340,830 |
| 2019 | $5,238 | $429,476 | $95,328 | $334,148 |
| 2018 | $4,896 | $421,056 | $93,459 | $327,597 |
| 2017 | $4,778 | $412,801 | $91,627 | $321,174 |
| 2016 | $4,700 | $404,708 | $89,831 | $314,877 |
| 2015 | $4,630 | $398,630 | $88,482 | $310,148 |
| 2014 | $4,556 | $390,822 | $86,749 | $304,073 |
Source: Public Records
Map
Nearby Homes
- 3375 Karok Ave
- 3454 Oak Glen Ln
- 4471 Moraga Ave
- 3369 Geddes Dr
- 3592 Hatteras Ave
- 4786 Moraga Ave
- 3701 Tavara Cir
- 3146-48 Jemez Dr
- 4664 Isleta Ave
- 3933 Willamette Ave
- 3179 Driscoll Dr
- 4716 Murat Place
- 4687 Murat Ct
- 2860 Aber St
- 2901 Havasupai Ave
- 3063 Nute Way
- 3069 Conner Way
- 3634 Morlan St
- 4653 Leathers St
- 4182 Seri St
- 3416 Idlewild Way
- 3422 Idlewild Way
- 3410 Idlewild Way
- 3415 Jemez Dr Unit 17
- 3409 Jemez Dr
- 3428 Idlewild Way
- 3404 Idlewild Way
- 3421 Jemez Dr Unit 23
- 3403 Jemez Dr Unit 5
- 3403 Jemez Dr
- 3409 Idlewild Way
- 3427 Jemez Dr Unit 29
- 3434 Idlewild Way
- 3415 Idlewild Way
- 3403 Idlewild Way
- 3431 Idlewild Way
- 3433 Jemez Dr Unit 35
- 3440 Idlewild Way
- 3410 Jemez Dr Unit 12
- 3437 Idlewild Way