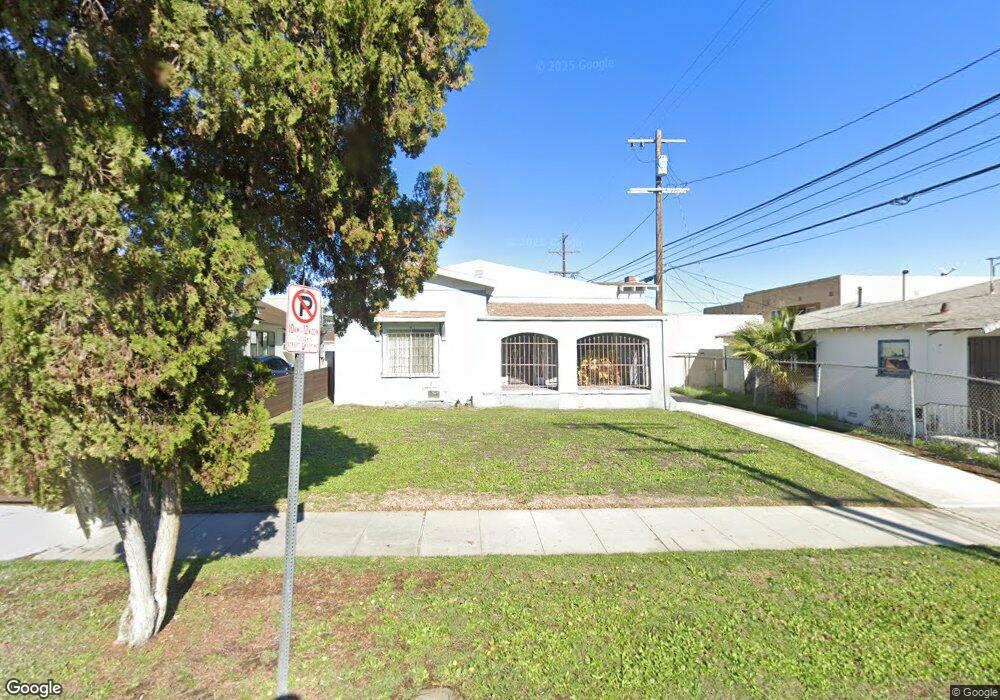
3417 W 59th St Los Angeles, CA 90043
Hyde Park NeighborhoodEstimated Value: $847,000 - $981,000
2
Beds
1
Bath
1,692
Sq Ft
$530/Sq Ft
Est. Value
About This Home
This home is located at 3417 W 59th St, Los Angeles, CA 90043 and is currently estimated at $897,484, approximately $530 per square foot. 3417 W 59th St is a home located in Los Angeles County with nearby schools including Fifty-Fourth Street Elementary School, Horace Mann Ucla Community, and Crenshaw Science, Technology, Engineering, Math And Medicine Magnet.
Ownership History
Date
Name
Owned For
Owner Type
Purchase Details
Closed on
Mar 8, 2024
Sold by
Mobley Sean Artemus
Bought by
Mobley Shaw Anthony
Current Estimated Value
Home Financials for this Owner
Home Financials are based on the most recent Mortgage that was taken out on this home.
Original Mortgage
$279,849
Outstanding Balance
$275,459
Interest Rate
6.94%
Mortgage Type
New Conventional
Estimated Equity
$622,025
Purchase Details
Closed on
May 28, 2021
Sold by
Marquina Cecilia
Bought by
Marquina Cecilia and Molina Marlyn
Purchase Details
Closed on
Jul 22, 2017
Sold by
Mobley Willie Pearl
Bought by
Mobley Shaw Anthony and Mobley Sean Artemus
Purchase Details
Closed on
Jan 3, 2002
Sold by
Duvall Barbara and Estate Of Johnie Lee Daniels
Bought by
Mobley Willie Pearl
Home Financials for this Owner
Home Financials are based on the most recent Mortgage that was taken out on this home.
Original Mortgage
$152,000
Interest Rate
6.89%
Create a Home Valuation Report for This Property
The Home Valuation Report is an in-depth analysis detailing your home's value as well as a comparison with similar homes in the area
Home Values in the Area
Average Home Value in this Area
Purchase History
| Date | Buyer | Sale Price | Title Company |
|---|---|---|---|
| Mobley Shaw Anthony | -- | First American Title | |
| Marquina Cecilia | -- | Pacific Coast Title | |
| Mobley Shaw Anthony | -- | Accommodation | |
| Mobley Willie Pearl | $160,000 | Fidelity Title |
Source: Public Records
Mortgage History
| Date | Status | Borrower | Loan Amount |
|---|---|---|---|
| Open | Mobley Shaw Anthony | $279,849 | |
| Previous Owner | Mobley Willie Pearl | $152,000 |
Source: Public Records
Tax History Compared to Growth
Tax History
| Year | Tax Paid | Tax Assessment Tax Assessment Total Assessment is a certain percentage of the fair market value that is determined by local assessors to be the total taxable value of land and additions on the property. | Land | Improvement |
|---|---|---|---|---|
| 2025 | $3,097 | $236,341 | $189,082 | $47,259 |
| 2024 | $3,097 | $231,708 | $185,375 | $46,333 |
| 2023 | $3,046 | $227,166 | $181,741 | $45,425 |
| 2022 | $2,916 | $222,713 | $178,178 | $44,535 |
| 2021 | $2,870 | $218,347 | $174,685 | $43,662 |
| 2019 | $2,790 | $211,872 | $169,504 | $42,368 |
| 2018 | $2,639 | $207,719 | $166,181 | $41,538 |
| 2016 | $2,509 | $199,655 | $159,729 | $39,926 |
| 2015 | $2,474 | $196,657 | $157,330 | $39,327 |
| 2014 | $2,491 | $192,806 | $154,249 | $38,557 |
Source: Public Records
Map
Nearby Homes
- 5879 Crenshaw Blvd
- 3521 W 58th Place
- 5742 Chesley Ave
- 3206 W 59th St
- 5738 Chesley Ave
- 6021 Brynhurst Ave
- 6121 Crenshaw Blvd
- 5471 Crenshaw Blvd
- 5465 S Victoria Ave
- 3632 W 59th St
- 6126 Brynhurst Ave
- 6027 10th Ave
- 5449 S Victoria Ave
- 3115 W 60th St
- 3473 W 63rd St
- 5732 Hillcrest Dr
- 5868 Deane Ave
- 6125 West Blvd
- 6302 Brynhurst Ave
- 3304 W 63rd St
- 3423 W 59th St Unit ADU
- 3429 W 59th St
- 3414 W 58th Place
- 3422 W 58th Place
- 3433 W 59th St
- 3428 W 58th Place
- 3410 W 59th St
- 3416 W 59th St
- 3439 W 59th St
- 3430 W 58th Place
- 3422 W 59th St
- 5903 Crenshaw Blvd
- 3428 W 59th St
- 5909 Crenshaw Blvd
- 3438 W 58th Place
- 3432 W 59th St
- 3443 W 59th St
- 3438 W 59th St
- 3442 W 58th Place
- 3449 W 59th St