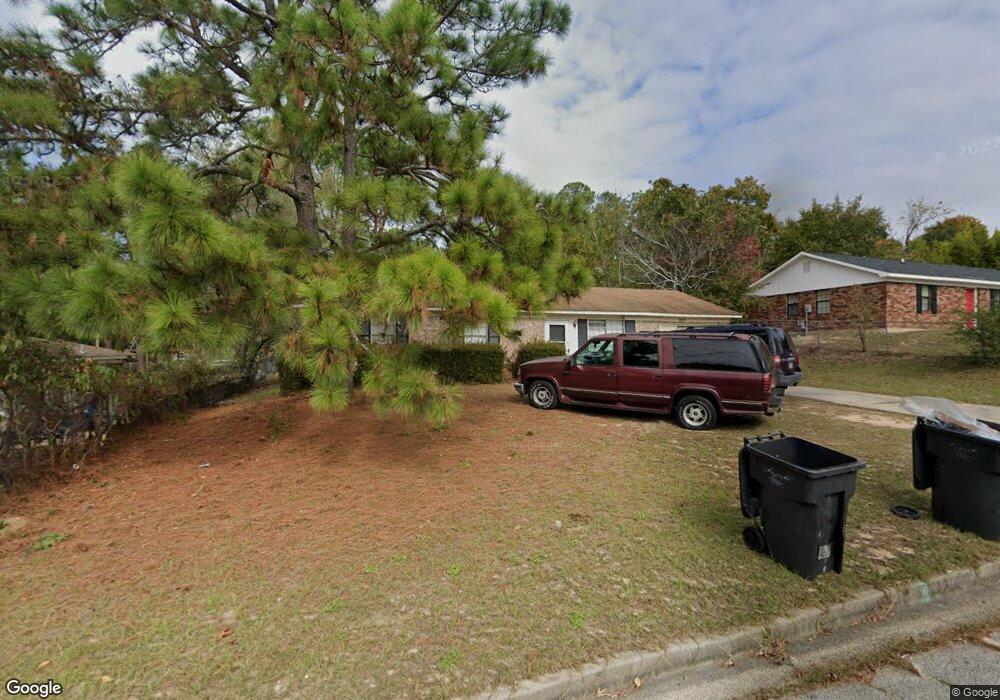
3419 Chadbourne St Augusta, GA 30906
Meadowbrook NeighborhoodEstimated Value: $136,000 - $161,000
3
Beds
2
Baths
1,479
Sq Ft
$101/Sq Ft
Est. Value
About This Home
This home is located at 3419 Chadbourne St, Augusta, GA 30906 and is currently estimated at $149,204, approximately $100 per square foot. 3419 Chadbourne St is a home located in Richmond County with nearby schools including Glenn Hills Elementary School, Glenn Hills Middle School, and Johnson Magnet.
Ownership History
Date
Name
Owned For
Owner Type
Purchase Details
Closed on
Mar 1, 2010
Sold by
Hud-Housing Of Urban Dev
Bought by
Abe Properties Llc
Current Estimated Value
Purchase Details
Closed on
Sep 1, 2009
Sold by
Midfirst Bk
Bought by
Hud-Housing Of Urban Dev
Purchase Details
Closed on
Jun 26, 1996
Sold by
Dixon Darlene
Bought by
Kelly Douglas Dixon Shirlane
Purchase Details
Closed on
Jun 12, 1996
Sold by
Housing & Urban Dev
Bought by
Kelly Douglas
Purchase Details
Closed on
Feb 28, 1996
Sold by
Williams Jacquelyn E By Atty
Bought by
Fleet Mortgage Corp
Purchase Details
Closed on
Nov 7, 1995
Sold by
Fleet Mortgage Corp
Bought by
Housing & Urban Dev
Purchase Details
Closed on
Jul 2, 1992
Sold by
Bird Thomas M
Bought by
Williams Jacquelyn E
Purchase Details
Closed on
Jun 30, 1992
Sold by
Bird Thomas M
Bought by
Williams Jacquelyn
Purchase Details
Closed on
Aug 7, 1991
Sold by
Veterans Affairs Administrator Of Veter
Bought by
Bird Thomas M
Purchase Details
Closed on
Aug 2, 1991
Sold by
Veterans Affairs Ad
Bought by
Bird Thomas M
Purchase Details
Closed on
Jan 2, 1991
Sold by
Edwards Derek V By Atty Edwards Barbara
Bought by
First Union Mortgage Corp
Create a Home Valuation Report for This Property
The Home Valuation Report is an in-depth analysis detailing your home's value as well as a comparison with similar homes in the area
Home Values in the Area
Average Home Value in this Area
Purchase History
| Date | Buyer | Sale Price | Title Company |
|---|---|---|---|
| Abe Properties Llc | -- | -- | |
| Hud-Housing Of Urban Dev | -- | -- | |
| Midfirst Bk | $160,000 | -- | |
| Kelly Douglas Dixon Shirlane | -- | -- | |
| Kelly Douglas Dixon Darlene Dixon S | -- | -- | |
| Kelly Douglas | -- | -- | |
| Fleet Mortgage Corp | -- | -- | |
| Housing & Urban Dev | $52,600 | -- | |
| Williams Jacquelyn E | -- | -- | |
| Williams Jacquelyn | $49,900 | -- | |
| Bird Thomas M | -- | -- | |
| Bird Thomas M | -- | -- | |
| First Union Mortgage Corp | -- | -- |
Source: Public Records
Tax History Compared to Growth
Tax History
| Year | Tax Paid | Tax Assessment Tax Assessment Total Assessment is a certain percentage of the fair market value that is determined by local assessors to be the total taxable value of land and additions on the property. | Land | Improvement |
|---|---|---|---|---|
| 2025 | $1,940 | $54,700 | $5,200 | $49,500 |
| 2024 | $1,940 | $45,896 | $5,200 | $40,696 |
| 2023 | $1,656 | $39,760 | $5,200 | $34,560 |
| 2022 | $1,243 | $30,254 | $5,200 | $25,054 |
| 2021 | $1,291 | $29,140 | $5,200 | $23,940 |
| 2020 | $1,274 | $29,140 | $5,200 | $23,940 |
| 2019 | $1,338 | $29,140 | $5,200 | $23,940 |
| 2018 | $1,346 | $29,140 | $5,200 | $23,940 |
| 2017 | $1,292 | $29,140 | $5,200 | $23,940 |
| 2016 | $1,293 | $29,140 | $5,200 | $23,940 |
| 2015 | $1,300 | $29,140 | $5,200 | $23,940 |
| 2014 | $1,302 | $29,140 | $5,200 | $23,940 |
Source: Public Records
Map
Nearby Homes
- 3407 Charing Cross Ct
- 3415 Cauthen Dr
- 2538 Kensington Dr W
- 2527 Blackstone St
- 3421 Mcalpine Dr
- 3331 Hillis Rd
- 3007 Meadowbrook Dr
- 3217 Hampton Cir
- 3529 Evangeline Dr
- 3121 Hampton Dr
- 3614 Rolling Meadows Dr
- 3602 Kinglet Ct
- 2916 Panhandle Cir
- 3621 Columbine Dr
- 3531 Spring Glen Ln
- 2896 Rasha Dr
- 3535 Redd Dr
- 3042 Johnny Ct
- 3632 Alene Cir
- 3004 Georgia Rd
- 3417 Chadbourne St
- 3421 Chadbourne St
- 3404 Charing Cross Ct
- 3415 Chadbourne St
- 3423 Chadbourne St
- 3402 Charing Cross Ct
- 3420 Chadbourne St
- 3422 Chadbourne St
- 3406 Charing Cross Ct
- 3413 Chadbourne St
- 3424 Chadbourne St
- 3425 Chadbourne St
- 2501 Banbury St
- 3425 Chadborne St
- 3409 Arden Ct
- 3408 Charing Cross Ct
- 3426 Chadborne St
- 3407 Arden Ct
- 3411 Chadbourne St
- 3426 Chadbourne St