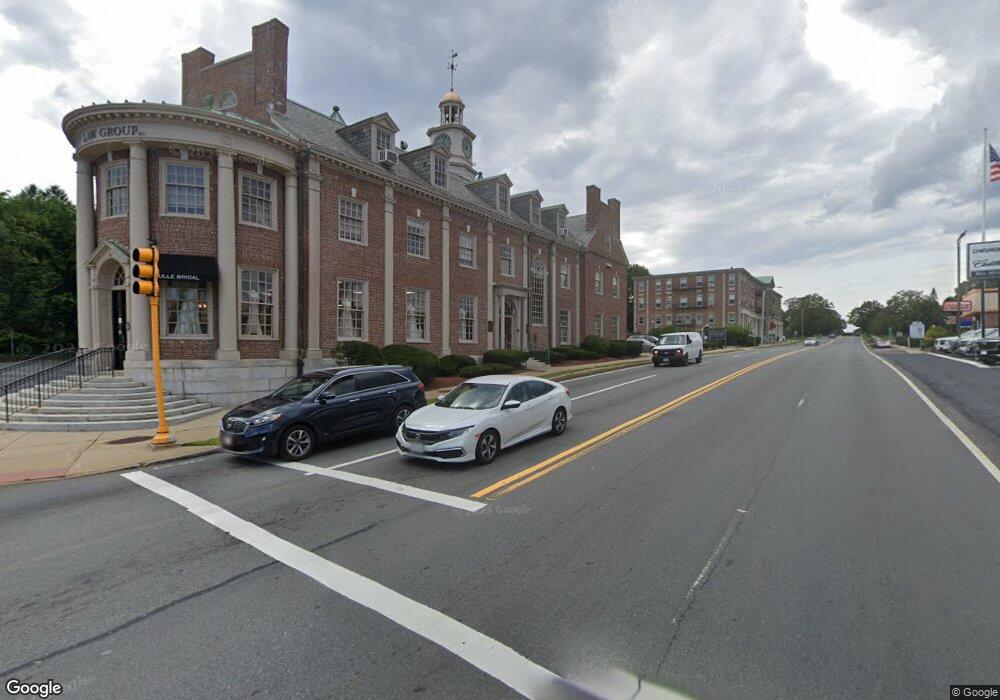
342 N Main St Andover, MA 01810
Shawsheen Heights NeighborhoodEstimated Value: $3,858,668
--
Bed
--
Bath
13,500
Sq Ft
$286/Sq Ft
Est. Value
About This Home
This home is located at 342 N Main St, Andover, MA 01810 and is currently estimated at $3,858,668, approximately $285 per square foot. 342 N Main St is a home located in Essex County with nearby schools including West Elementary School, Andover West Middle School, and Andover High School.
Ownership History
Date
Name
Owned For
Owner Type
Purchase Details
Closed on
Feb 2, 1995
Sold by
Lawrence Sb
Bought by
Frye Village Rt
Current Estimated Value
Home Financials for this Owner
Home Financials are based on the most recent Mortgage that was taken out on this home.
Original Mortgage
$760,000
Interest Rate
9.13%
Mortgage Type
Commercial
Create a Home Valuation Report for This Property
The Home Valuation Report is an in-depth analysis detailing your home's value as well as a comparison with similar homes in the area
Home Values in the Area
Average Home Value in this Area
Purchase History
| Date | Buyer | Sale Price | Title Company |
|---|---|---|---|
| Frye Village Rt | $950,000 | -- | |
| Frye Village Rt | $950,000 | -- |
Source: Public Records
Mortgage History
| Date | Status | Borrower | Loan Amount |
|---|---|---|---|
| Open | Frye Village Rt | $400,000 | |
| Closed | Frye Village Rt | $200,000 | |
| Closed | Frye Village Rt | $760,000 |
Source: Public Records
Tax History Compared to Growth
Tax History
| Year | Tax Paid | Tax Assessment Tax Assessment Total Assessment is a certain percentage of the fair market value that is determined by local assessors to be the total taxable value of land and additions on the property. | Land | Improvement |
|---|---|---|---|---|
| 2024 | $53,849 | $2,113,400 | $484,400 | $1,629,000 |
| 2023 | $49,001 | $1,793,600 | $440,200 | $1,353,400 |
| 2022 | $48,238 | $1,646,900 | $400,200 | $1,246,700 |
| 2021 | $45,520 | $1,620,500 | $400,200 | $1,220,300 |
| 2020 | $43,698 | $1,610,100 | $400,200 | $1,209,900 |
| 2019 | $43,081 | $1,566,000 | $379,500 | $1,186,500 |
| 2018 | $42,945 | $1,555,400 | $379,500 | $1,175,900 |
| 2017 | $48,673 | $1,839,500 | $379,500 | $1,460,000 |
| 2016 | $47,356 | $1,822,100 | $361,500 | $1,460,600 |
| 2015 | $45,156 | $1,823,000 | $361,500 | $1,461,500 |
Source: Public Records
Map
Nearby Homes
- 6 Windsor St
- 10 Martingale Ln Unit 10
- 24 York St
- 437 N Main St Unit C
- 5 Castle Heights Rd
- 38 Lincoln Cir E
- 102 Weare St
- 156 High St
- 21 Clubview Dr Unit 21
- 2 Powder Mill Square Unit 2B
- 1 Longwood Dr Unit 105
- 42 Stevens St
- 20 Walnut Ave
- 34 Leeds Terrace
- 25 Clubview Dr Unit 25
- 13 Clubview Dr Unit 13
- 5 Lafayette Ave
- 5 Marc Ln
- 170 Haverhill St Unit 138
- 5 W Kenneth St
- 2 Poor St
- 1 Lowell St
- 2 Lowell St
- 6 Poor St
- 354 No Main St Unit 308
- 354 No Main St Unit 301
- 7 Lowell St
- 344-358 N Main St
- 348 N Main St
- 348 N Main St Unit 348
- 348 N Main St Unit 348B
- 348 N Main St Unit 348B
- 5 Lowell St Unit A
- 5a Lowell St
- 2 Riverina Rd Unit B
- 53 Poor St
- 344 N Main St Unit 348A
- 344 N Main St Unit 348B
- 344 N Main St
- 344 N Main St