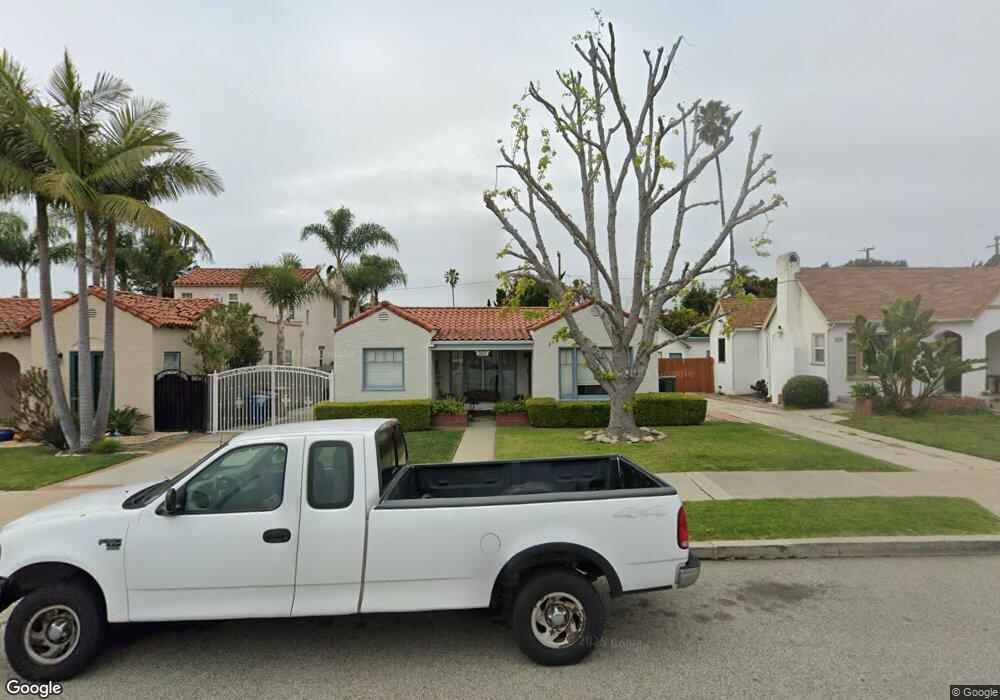
343 Coronado St Ventura, CA 93001
Midtown NeighborhoodEstimated Value: $842,621 - $997,000
2
Beds
1
Bath
1,114
Sq Ft
$832/Sq Ft
Est. Value
About This Home
This home is located at 343 Coronado St, Ventura, CA 93001 and is currently estimated at $926,905, approximately $832 per square foot. 343 Coronado St is a home located in Ventura County with nearby schools including Will Rogers Elementary School, Cabrillo Middle School, and Ventura High School.
Ownership History
Date
Name
Owned For
Owner Type
Purchase Details
Closed on
Nov 3, 2015
Sold by
Banner Tracy
Bought by
Banner Tracy and Jackson Tilford
Current Estimated Value
Home Financials for this Owner
Home Financials are based on the most recent Mortgage that was taken out on this home.
Original Mortgage
$277,981
Outstanding Balance
$216,468
Interest Rate
3.5%
Mortgage Type
FHA
Estimated Equity
$710,437
Purchase Details
Closed on
Mar 24, 2010
Sold by
Banner Tracy
Bought by
Banner Tracy
Home Financials for this Owner
Home Financials are based on the most recent Mortgage that was taken out on this home.
Original Mortgage
$259,000
Interest Rate
4.94%
Mortgage Type
New Conventional
Purchase Details
Closed on
Jun 21, 2006
Sold by
Jackson Tilford J
Bought by
Banner Tracy
Purchase Details
Closed on
Jun 9, 1998
Sold by
Arnold Lynn W
Bought by
Banner Tracy
Home Financials for this Owner
Home Financials are based on the most recent Mortgage that was taken out on this home.
Original Mortgage
$153,000
Interest Rate
7.17%
Create a Home Valuation Report for This Property
The Home Valuation Report is an in-depth analysis detailing your home's value as well as a comparison with similar homes in the area
Home Values in the Area
Average Home Value in this Area
Purchase History
| Date | Buyer | Sale Price | Title Company |
|---|---|---|---|
| Banner Tracy | -- | Pacific Coast Title Company | |
| Banner Tracy | -- | First American Title Company | |
| Banner Tracy | -- | Old Republic Title Company | |
| Banner Tracy | $170,000 | Lawyers Title |
Source: Public Records
Mortgage History
| Date | Status | Borrower | Loan Amount |
|---|---|---|---|
| Open | Banner Tracy | $277,981 | |
| Closed | Banner Tracy | $259,000 | |
| Previous Owner | Banner Tracy | $153,000 |
Source: Public Records
Tax History Compared to Growth
Tax History
| Year | Tax Paid | Tax Assessment Tax Assessment Total Assessment is a certain percentage of the fair market value that is determined by local assessors to be the total taxable value of land and additions on the property. | Land | Improvement |
|---|---|---|---|---|
| 2025 | $3,010 | $271,407 | $191,591 | $79,816 |
| 2024 | $3,010 | $266,086 | $187,835 | $78,251 |
| 2023 | $2,975 | $260,869 | $184,152 | $76,717 |
| 2022 | $2,775 | $255,754 | $180,541 | $75,213 |
| 2021 | $2,723 | $250,740 | $177,001 | $73,739 |
| 2020 | $2,697 | $248,171 | $175,187 | $72,984 |
| 2019 | $2,649 | $243,305 | $171,752 | $71,553 |
| 2018 | $2,606 | $238,535 | $168,385 | $70,150 |
| 2017 | $2,552 | $233,859 | $165,084 | $68,775 |
| 2016 | $2,504 | $229,275 | $161,848 | $67,427 |
| 2015 | $2,478 | $225,833 | $159,418 | $66,415 |
| 2014 | $2,438 | $221,412 | $156,297 | $65,115 |
Source: Public Records
Map
Nearby Homes
- 1901 Ocean Ave
- 205 Jordan Ave
- 1907 Ocean Ave
- 1884 Channel Dr
- 400 Arcade Dr
- 44 Coronado St Unit 202
- 66 San Clemente St
- 2001 Alessandro Dr
- 69 S Seaward Ave
- Plan D at Portalvo - Townhomes
- Plan F at Portalvo - Townhomes
- Plan E at Portalvo - Townhomes
- Plan O at Portalvo - Condos/Flats
- Plan A at Portalvo - Townhomes
- Plan H at Portalvo - Condos/Flats
- Plan L at Portalvo - Condos/Flats
- Plan C at Portalvo - Townhomes
- Plan B at Portalvo - Townhomes
- Plan J at Portalvo - Condos/Flats
- Plan G at Portalvo - Townhomes
- 359 Coronado St
- 325 Coronado St
- 375 Coronado St
- 309 Coronado St
- 340 San Clemente St
- 324 San Clemente St
- 391 Coronado St
- 297 Coronado St
- 393 Coronado St
- 295 Coronado St
- 358 San Clemente St
- 308 San Clemente St
- 340 Coronado St
- 326 Coronado St
- 360 Coronado St
- 376 San Clemente St
- 294 San Clemente St
- 310 Coronado St
- 376 Coronado St
- 396 San Clemente St